


Hardware components | ||||||
 |
| × | 1 | |||
 |
| × | 1 | |||
| × | 1 | ||||
| × | 1 | ||||
| × | 1 | ||||
| × | 1 | ||||
| × | 1 | ||||
| × | 1 | ||||
Software apps and online services | ||||||
| ||||||
 |
| |||||
 |
| |||||
Hand tools and fabrication machines | ||||||
 |
| |||||
| ||||||
| ||||||
My idea behind WaterLens was to explore whether a small, relatively inexpensive device could help communities monitor local water sources using several sensors and Edge AI.
Instead of treating pH, ORP, turbidity and TDS as four independent measurements, WaterLens combines their raw sensor signals into a multichannel pattern. The goal is not to replace laboratory testing or determine whether water is safe, but to recognize previously measured patterns and detect when a sample differs from a learned reference.
To do this, WaterLens uses two separate Edge Impulse models: a multiclass classifier and an anomaly model trained on tap-water measurements. Both run locally on the Arduino UNO Q.
InspirationWaterLens builds on ideas from two earlier Edge Impulse projects.
In my artificial tongue project from 2023, I combined TDS and turbidity sensors with Edge Impulse to classify different liquids. Besides demonstrating sensor fusion, that project showed me the importance of repeatable sensor placement and representative training data.
Another inspiration was Ocean Water Quality Classification for Bacteria Contamination Using TinyML and Sensor Fusion by Luis Burgos, winner of Best Overall Project in the Edge Impulse Hackathon 2025. That project combined several water sensors with laboratory-validated samples.
WaterLens takes a different approach: rather than attempting to infer contamination or classify water as safe or unsafe, it combines classification of previously measured sample groups with anomaly detection against a learned local reference.
How WaterLens worksWaterLens uses four sensor channels: pH, ORP, turbidity and TDS. Each test produces a 100 × 4 time-series sample at 10 Hz.
The measurements are collected in two 10-second phases. First, pH, ORP and turbidity are recorded. TDS is then measured separately because operating the TDS probe together with the other probes affected the measurements in my setup. The two sequences are combined into one four-channel sample.
That sample is evaluated locally by two Edge Impulse models:
- the classifier identifies which previously learned sample group the measurement most closely resembles;
- the anomaly model compares summary features from the measurement with the learned tap-water reference.
The results, sensor values and a short locally generated interpretation are presented through a web dashboard running on the UNO Q.
Using WaterLensWaterLens is intended to be usable without a laptop during normal sampling. The OLED display and two buttons provide three main options: Collect Data, Test Water and Offline Mode. BLUE cycles through the options and WHITE selects the current option.
Collect Data records labelled measurements that can be saved locally as CSV files for later model development. The user selects a sample group, follows the two measurement phases, and can then save or discard the completed sample. Further samples can be recorded using the same label, or another label can be selected.
Test Water uses the same two-phase measurement sequence but sends the completed sample directly to the classifier and tap-water anomaly model on the UNO Q. The OLED shows the predicted sample group and classifier confidence. From the result screen, the user can display a QR code to open the more detailed local dashboard on a phone or computer.
Offline Mode is intended for locations where an existing Wi-Fi network is unavailable. It explicitly starts a WaterLens Wi-Fi access point rather than switching networks automatically. The OLED can then display the QR code for the offline dashboard. The access point remains active until the user explicitly stops it, allowing the device to return to the main menu while continuing to provide local dashboard access.
The core of WaterLens is an Arduino UNO Q. In this project, its combination of microcontroller I/O and Linux-side processing makes it possible to handle the sensors and user interface while also running the Edge Impulse models and local dashboard on the same device.
The current prototype uses four Grove water sensors:
- pH
- ORP
- turbidity
- TDS
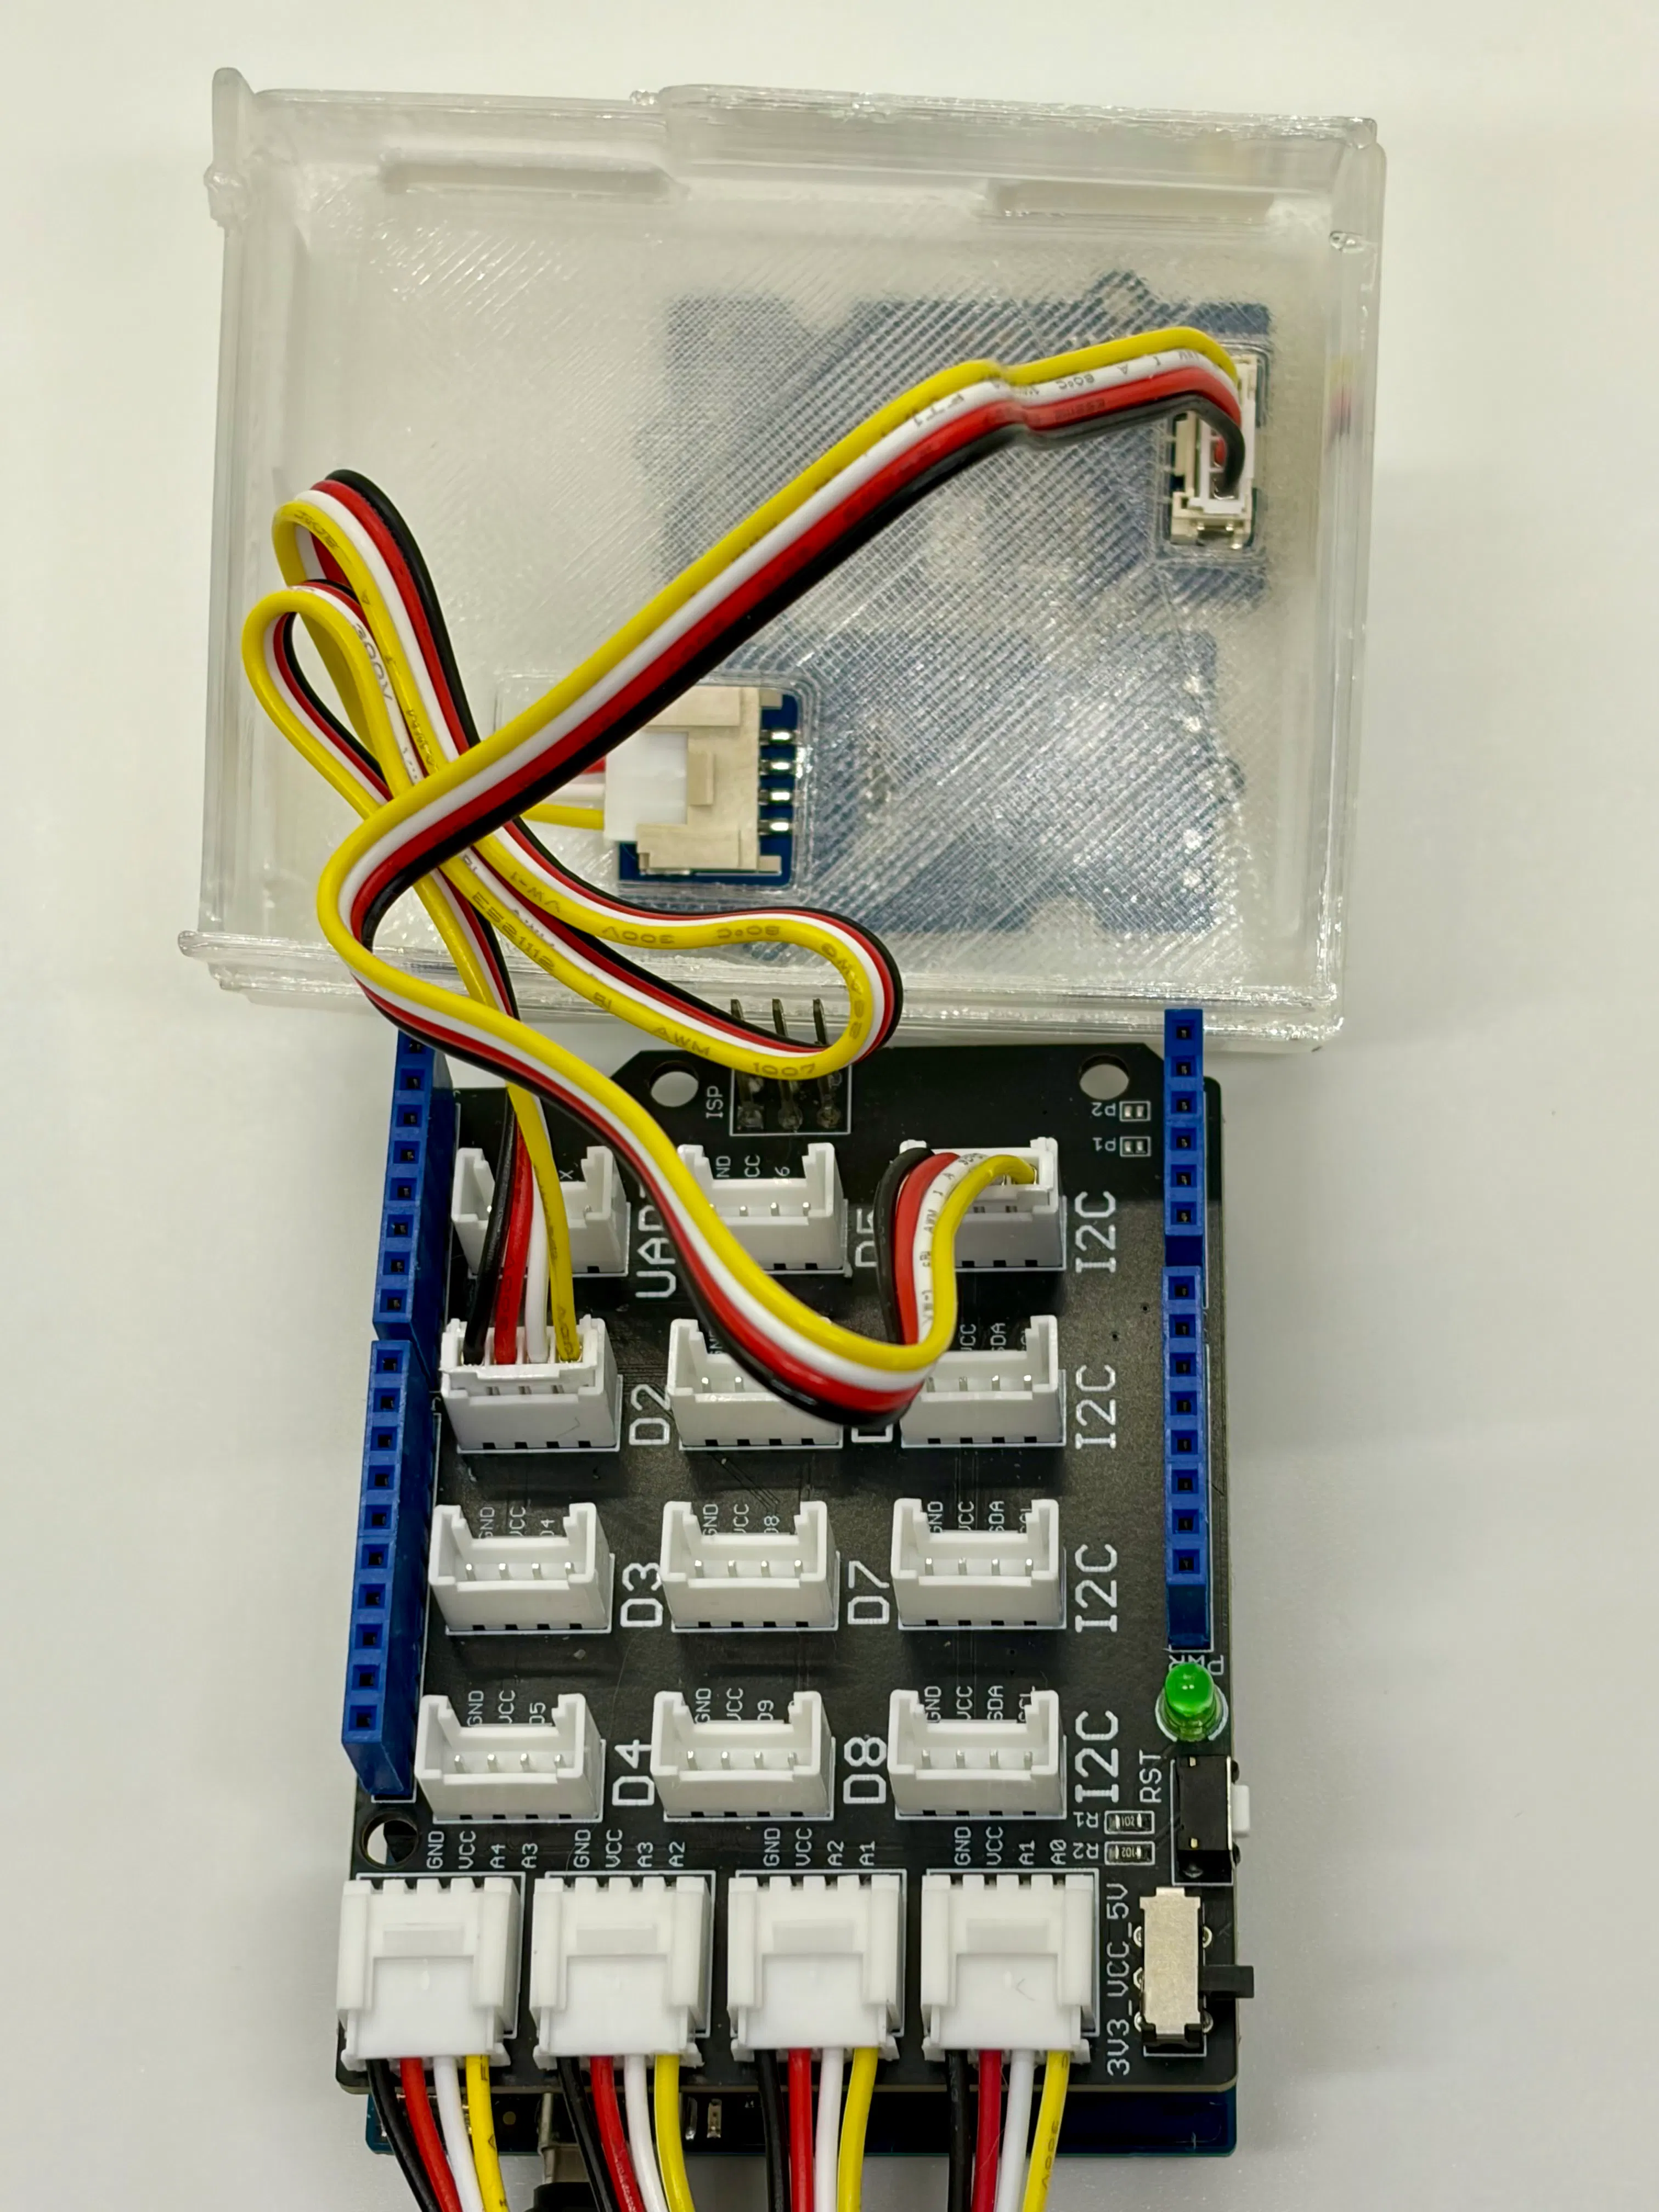
The sensors are connected through a Grove Base Shield. Two buttons control the measurement workflow, while a small OLED display guides the user through sampling without requiring a laptop.
What the sensors measureWater quality cannot be described by a single measurement. The four sensors used in WaterLens respond to different physical and chemical properties of the sample, which is why their combined pattern is more interesting than any one value on its own.
pH — acidity and alkalinity.pH reflects hydrogen-ion activity in an aqueous solution. Lower values indicate more acidic conditions and higher values more alkaline conditions; around room temperature, pH 7 is approximately neutral. The pH probe therefore adds information about the acid-base chemistry of the sample.
ORP — oxidation-reduction potential.ORP describes the tendency of the solution to participate in oxidation or reduction reactions and is measured in millivolts relative to a reference electrode. More positive values generally represent more oxidizing conditions and more negative values more reducing conditions. ORP is not itself a measure of contamination or water safety.
Turbidity — suspended material and optical clarity.Turbidity describes how particles suspended in water affect the passage of light. The Grove sensor uses an optical emitter and detector to respond to changes caused by suspended material. In WaterLens the turbidity conversion is not laboratory-calibrated, so the raw sensor response is more important to the machine-learning model than the displayed NTU estimate.
TDS — dissolved material.TDS stands for Total Dissolved Solids. Strictly, TDS is the mass of dissolved residue remaining after water is evaporated, but electronic TDS meters normally estimate it from electrical conductivity. They are therefore especially sensitive to dissolved ions such as salts and minerals, and the relationship between conductivity and true TDS depends on the composition of the water. A higher TDS reading does not by itself mean that water is contaminated or unsafe.
Below isan overview of the four measurements used by WaterLens: pH, oxidation-reduction potential (ORP), turbidity and total dissolved solids (TDS). AI-assisted illustration; technical content reviewed by the author against sensor documentation and standard measurement definitions.
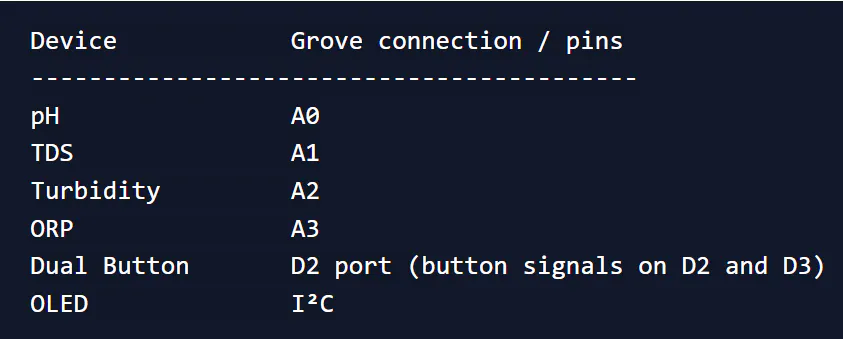
The Grove Base Shield makes the wiring straightforward. The prototype uses the following connections:
Device            Grove connection / pins
------------------------------------------
pH                A0
TDS               A1
Turbidity         A2
ORP               A3
Dual Button       D2 port (button signals on D2 and D3)
OLED I²CI designed several 3D-printed parts to keep the prototype compact and make the measurement setup easier to reproduce. I used transparent TPU for most of the enclosure so that status LEDs on the electronics remain visible.
The UNO Q is mounted in a three-piece printed enclosure. The four sensor interface boards are housed in a separate case with a lid to keep the electronics together and make the setup easier to handle.
I also designed a holder for the glass beaker. Its main purpose is to keep the probes, particularly the turbidity sensor, in a consistent position between measurements.
The CAD files for the printed parts are included with the project files.
Measurement setupThe physical measurement setup is intentionally simple. The probes are placed in a glass beaker containing the water sample, with the sensor holder helping to keep their positions reasonably repeatable. This is particularly important for the turbidity sensor, where changes in physical geometry can affect the measurement.
Between different water samples, the probes were rinsed with tap water and gently wiped with paper tissue. For future measurements I would use distilled or deionized water for rinsing and blot the pH electrode rather than wiping it, following the probe-care recommendations. After insertion into a new sample, the water was gently stirred and the probes dipped a few times, then left undisturbed briefly before starting the measurement.
During development, I observed that operating the TDS probe together with the other probes in the same small water sample affected the measurements in this setup. I therefore separated the acquisition into two phases: pH, ORP and turbidity first, followed by TDS.
The current setup is still a prototype rather than a finished field instrument, but it is compact enough to be moved between sampling locations and operated without an external computer.
Building the datasetTo train the models, I needed a repeatable way to collect labelled samples directly with WaterLens.
Each completed sample contains 100 rows at 10 Hz, corresponding to 10 seconds of data, with four channels: pH, ORP, turbidity and TDS. The machine-learning models use the raw sensor readings rather than the approximate values converted into human-readable units. Those conversions are performed separately for the dashboard.
The measurement is split into two 10-second phases. pH, ORP and turbidity are sampled first, followed by TDS in a separate beaker containing the same water sample. The two sequences are then aligned by sample position and combined into one four-channel input for the model. This means that values appearing on the same row correspond to the same point in each sequence, but were not measured simultaneously.
The OLED display and two buttons guide the process. I can select the sample group, start each measurement phase and finally save or discard the completed sample. Saved measurements are stored locally as CSV files and can later be uploaded to Edge Impulse.
For the current prototype, I have collected several sample groups, including tap water, seawater and water from different local ditches. The seawater and ditch samples were collected from real outdoor locations around the local area rather than being prepared artificially. These names are working labels for the machine-learning model rather than chemical descriptions of the water.
I also deliberately introduced variation within individual groups. Tap water, for example, was measured at different temperatures rather than treating one particular measurement as representative of all tap water. This became important during testing, as described later.
The same workflow can therefore be used both for collecting training data and for testing new samples, making it possible to gradually build reference datasets using the WaterLens hardware itself.
Adding sample groups
The labels offered by the Collect Data menu are stored in labels.txt, so new sample groups can be added without changing the application code. After restarting WaterLens, the updated labels are available from the OLED menu and are used when naming the collected CSV files. Adding a label only enables data collection for that group; for it to become a classifier class, the new measurements must also be added to the Edge Impulse classification project, the model retrained, and the updated model.eim deployed to the UNO Q.
After collecting the samples, I uploaded the CSV files to Edge Impulse and created two separate Edge Impulse projects: one for multiclass classification and one for tap-water anomaly detection.
The input is a 100 × 4 sample representing the four raw sensor channels. For the multiclass model, this input is passed to a neural-network classifier trained on the different sample groups.
The classifier is useful for identifying which known group a new sample resembles most closely, but it has an important limitation: it must distribute its output among the classes it already knows. Even a genuinely unfamiliar sample will therefore produce scores for those classes. A confidence threshold can be used to report weak classifications as uncertain, but it does not turn the classifier into an unknown-sample detector.
For that reason, I added a second model based on anomaly detection.
The anomaly model uses tap-water measurements as its reference data. In this impulse, I use Edge Impulse's Flatten processing block and GMM anomaly detection, with the average value from each of the four raw sensor channels used as input features. Instead of predicting one of the known classes, the model produces an anomaly score representing the degree of deviation from the learned tap-water reference.
This gives the two models distinct roles: the classifier identifies the closest known sample group, while the anomaly model evaluates similarity to the tap-water reference.
After training, I deployed both Edge Impulse models back to the UNO Q so that inference can run locally.
The WaterLens application is built in Arduino App Lab and divided between the two sides of the UNO Q. The microcontroller handles sensor sampling, the buttons and OLED display. The Linux side handles data storage, Edge Impulse inference, the local web dashboard and the higher-level application logic.
The Edge Impulse models are exported as EIM binaries for Linux and included with the application. When a sample is tested, the completed four-channel input is passed to both models and their outputs are combined for presentation in the dashboard.
Keeping inference on the UNO Q is important for the intended use of WaterLens. Sampling locations may have unreliable or unavailable Internet access, so the sensor data does not need to be sent to a cloud service for analysis.
The same local-first approach also avoids dependence on continuous cloud processing and allows the same reusable sensing hardware to be used for repeated measurements. Offline Mode uses a NetworkManager hotspot profile configured once on the UNO Q; the one-time setup procedure is documented in the GitHub README.
The complete application source code and supporting files are available in the project repository.
Local dashboard and interpretationThe raw model outputs are useful during development, but they are not how I want someone to interact with WaterLens in practice. The result should be understandable from a nearby phone or computer without opening a terminal.
For this reason, I built a local web dashboard running on the UNO Q. After a test, it shows the closest known sample group and classifier confidence together with the result from the tap-water anomaly model. The dashboard can be opened conveniently using a QR code shown on the OLED display.
The dashboard also converts the sensor readings into more familiar units where possible. These values need to be interpreted cautiously: several sensors still require proper calibration, temperature compensation is limited, and the turbidity value is currently an indicative estimate rather than a laboratory-grade NTU measurement.
I also wanted WaterLens to explain the result rather than simply display a collection of numbers. A small local language model running on the UNO Q therefore generates a short interpretation from the measured facts and model outputs.
The language model is deliberately constrained. Its task is to summarize the supplied information, not to invent causes, contaminants or conclusions about whether the water is safe to drink.
The generated interpretation is also validated by the application before it is displayed. If it does not meet the validation rules, WaterLens uses a deterministic fallback explanation instead.
The dashboard can be accessed in two ways. On an existing local network, a phone or computer can connect to the UNO Q normally. For locations without Wi-Fi or Internet access, Offline Mode turns the UNO Q into its own Wi-Fi access point.
For offline use, connect the phone or computer to the WaterLens Wi-Fi network using the password waterlens123. Once connected, press WHITE on the device to display the QR code for the local dashboard.
WaterLens then shows the corresponding dashboard QR code on the OLED, allowing a phone or computer to connect directly without a router, Internet connection or cloud service.
Results and what I learnedOne of the clearest lessons from the project was that very good-looking model results can be misleading when the dataset is still small.
With only tap water and seawater in the first dataset, classification initially appeared almost trivial. Adding more measurements and more sample groups quickly showed that it was not.
Tap water was a useful example. Measurements at different temperatures did not always produce the same sensor patterns even though the water came from the same source. Some early warmer tap-water samples were classified incorrectly, showing that adding representative variation to the training data was more important than optimizing the model around the original samples.
As more groups were added, the problem also became less artificial. Seawater produced particularly different TDS readings in my measurements, while some of the ditch-water groups had much more similar overall sensor patterns.
I also encountered cases where the expected class had the highest score but did not pass the selected confidence threshold. In one early seawater test, seawater was the strongest prediction but the result was reported as uncertain at a threshold of 0.6. Reducing the threshold to 0.5 would have produced the expected result, but changing a threshold simply to make one sample pass would not have been convincing.
Instead, I collected additional data and retrained the model so that the dataset better represented the variation it needed to handle. With the expanded dataset, the seawater measurements were classified correctly without lowering the confidence threshold. This was a useful reminder that the better fix was not to tune the decision rule around one troublesome sample, but to improve the data behind the model.
The main result for me is therefore not a single accuracy number. The experiments suggest that sensor fusion can distinguish water-sample patterns and could support monitoring, but its usefulness depends strongly on whether the training data represents the conditions the device will actually encounter.
LimitationsWaterLens is a prototype, and its results need to be interpreted within several important limitations:
- Sensor accuracy: pH and TDS values are currently approximate, temperature compensation is limited, ORP is shown without a stored calibration offset, and the turbidity conversion is not laboratory-calibrated. The raw signals can still be useful to the machine-learning models, but the displayed values are not reference measurements.
- Limited dataset: many samples are repeated measurements from the same physical water source or container. These are useful for capturing measurement variation, but they are not equivalent to independent samples from many different sources, so good performance on the current dataset does not make WaterLens a general water-quality classifier.
- Working labels: names such as tap water, seawater and ditch water identify groups in the dataset; they are not chemical classifications.
- Anomaly detection: the anomaly model can indicate that the measured pattern differs from its tap-water reference, but it cannot determine the cause. A change that does not significantly affect the four measured sensor channels may not be detected.
- Thresholds: the anomaly threshold is selected for the current reference data and testing and should be reevaluated as the dataset grows.
WaterLens should therefore be viewed as a screening and monitoring prototype. It can identify changes in measured sensor patterns and indicate samples that may deserve further investigation, but it cannot determine whether water is safe to drink or replace chemical or microbiological testing.
From prototype to community water monitorThe current prototype demonstrates the basic concept, but several developments would make WaterLens much more useful for practical monitoring:
- Location-specific baselines: collect repeated measurements from the same stream, ditch or shoreline and learn what is typical for that particular location.
- Trend monitoring: use repeated measurements to detect gradual changes rather than evaluating each sample in isolation.
- Water-temperature measurement: add a temperature sensor to enable temperature compensation.
- Better measurements: improve sensor calibration, temperature compensation and reference measurements.
- Measurement history: store timestamped measurement history with optional location metadata.
- Baseline alerts: use repeated measurements to flag when a local water source deviates substantially from its learned historical pattern. Such an alert would indicate that further investigation may be warranted; it would not be a statement that the water is unsafe.
- Deployment to other locations: build representative local reference datasets for new monitoring sites rather than relying on one universal model. The same WaterLens hardware and workflow could then be adapted to different streams, shorelines or other water sources.
This would shift the emphasis from trying to define universal limits toward detecting when a particular water source begins to behave differently from its own previous measurements. Such a change would be a reason for further investigation, not a safety verdict.
WaterLens explores what becomes possible when several inexpensive water sensors are treated as a combined pattern rather than as isolated measurements.
The prototype combines local sensor acquisition, Edge Impulse classification, reference-based anomaly detection and a mobile dashboard on one Arduino UNO Q. The experiments also show why representative data, repeatable measurements and proper sensor calibration matter at least as much as the machine-learning model itself.
WaterLens is not a laboratory instrument or a drinking-water safety detector. It is a platform for exploring whether low-cost, local and repeatable Edge AI measurements can make changes in measured water-sample patterns easier to notice.


Comments