


Hardware components | ||||||
 |
| × | 1 | |||
Software apps and online services | ||||||
| ||||||
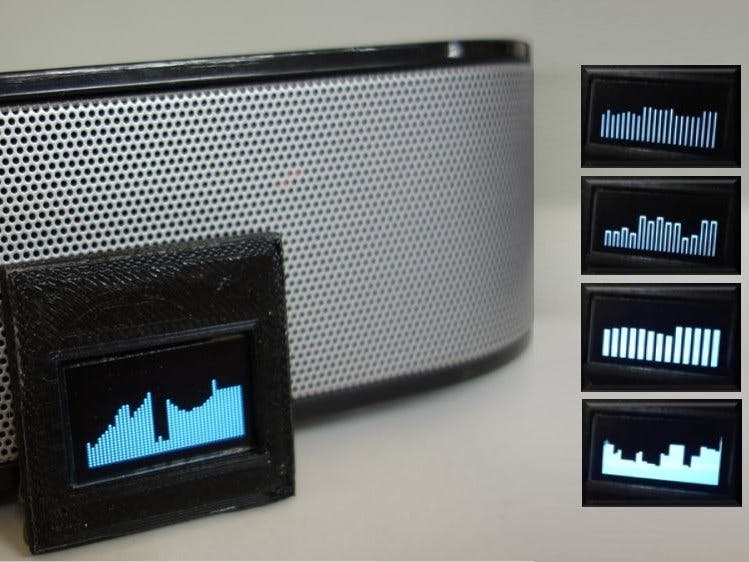
If my 8x8 LED matrix audio level display is insufficient for you, I'll show you here how to use a 128x32 display to view an audio spectrum.
How the visual representation of the spectrum should look like, you can set yourself with a view lines of code. My version is a bar graph.
What You NeedThe hardware you need is the display itself. But in the I2C version with the driver IC SSD1306.
As you can see in my previous projects, I like to use Lazarus (based on Freepascal) to code on a Raspberry. If you're not common with it, you'll find some advantages on my blog.
Like the 8×8 LED matrix there is needed a component of TMS software to control the 128×32 display. How to install it in Lazarus, I described in the article 8×8 LED matrix with Raspberry and Lazarus.
The components of TMS have been developed for the hardware of adafruit. But it also works with other manufacturers.
I’m using a existing display with 128×64 pixels. Which unfortunately can be addressed only for 32 lines. But the result looks pretty useful too.
The great thing is that the program works just as you learned at the audio level meter article.
The connection to the display is done via the component TTMSLCLAdaDispl128x32. In the app sample I use the instance display, so that the amount of writing is a little smaller.
Initializing works very similar to the 8×8 LED matrix. The address for the I2C is hexadecimal 3C (or as decimal number: 60).
display.I2CAddress:=Hex2Dec('$3c');
display.Open;
display.Clear;
You can use the command i2cdetect -y 1 in a shell to get the address of your device.
MP3The basic functions of the MP3 processing are the same as in the previous article. For the MP3 output the BASS library of un4seen.com is used again.
Audio SpectrumThe visualization of the audio spectrum is triggered by a timer event. As timer interval I use 100 ms.
In order to get the appropriate data in parallel to the sound output, the BASS library provides the function ChannelGetData.
BASS_ChannelGetData(Channel, @FFTData, 1024);
With a few instructions, an audio spectrum can be generated from the data. Here is the function of the visualization.
procedure TMainForm.Timer1Timer(Sender: TObject);
...
begin
 //If there is no sound, then leave this procedure
 if BASS_ChannelIsActive(channel)<>BASS_ACTIVE_PLAYING then Exit;
 BASS_ChannelGetData(Channel, @FFTData, 1024);
 ...
 //Clear display
 display.Clear;
 //Clear bitmap for the screen
 Bitmap.Canvas.Brush.Color:=clBlack;
 Bitmap.Canvas.Pen.Color:=clBlack;
 Bitmap.Canvas.Rectangle(0,0,Bitmap.Width,Bitmap.Height);
 Bitmap.Canvas.Pen.Color:=clWhite;
 if CheckboxFilled.Checked=true then Bitmap.Canvas.Brush.Color:=clWhite;
 j:=Round(128/SpinEditColWidth.Value);
 if j*SpinEditColWidth.Value>127 then j:=j-1;
 for i := 0 to j do
   begin
     YVal:=Abs(FFTData[(i*1)+5]);
     YPosI:=Trunc((YVal)*500);
     if YPosI>MaxBar then MaxBar:=YPosI;
     YPos:=conv(YPosI/MaxBar*SpecHeight);
     if YPos>SpecHeight then YPos:=SpecHeight;
     if YPos>=FFTPeacks[i] then FFTPeacks[i]:=YPos
     else FFTPeacks[i]:=FFTPeacks[i]-PeakFall;
     if YPos>=FFTFallOff[i] then FFTFallOff[i]:=YPos
     else FFTFallOff[i]:=FFTFallOff[i]-LineFall;
     if (SpecHeight-FFTPeacks[i])>SpecHeight then FFTPeacks[i]:=0;
     if (SpecHeight-FFTFallOff[i])>SpecHeight then FFTFallOff[i]:=0;

     //Output on display 128x32
     if CheckboxFilled.Checked=true then
       display.FillRect(X+(i*SpinEditColWidth.Value),Y+SpecHeight-FFTFallOff[i],
         X+((i+1)*SpinEditColWidth.Value)-1-SpinEditGap.Value,Y+SpecHeight)
     else
       display.DrawRect(X+(i*SpinEditColWidth.Value),Y+SpecHeight-FFTFallOff[i],
         X+((i+1)*SpinEditColWidth.Value)-1-SpinEditGap.Value,Y+SpecHeight);

     //Output on screen
     Bitmap.Canvas.Rectangle(X+(i*SpinEditColWidth.Value),Y+SpecHeight-FFTFallOff[i],
       X+((i+1)*SpinEditColWidth.Value)-SpinEditGap.Value,Y+SpecHeight);
   end;
 //Show it on screen
 Panel1.Canvas.CopyRect(Rect(0,0,Bitmap.Width,Bitmap.Height),Bitmap.Canvas,
   Rect(0,0,Bitmap.Width,Bitmap.Height));
 //Show it on display
 display.Display;
end;
For your first tests it’s best to download the sample app and have a look at my version of the spectrum display.
Have fun experimenting!
You find some more download links on this article.


Comments