


Hardware components | ||||||
 |
| × | 1 | |||
| × | 1 | ||||
Software apps and online services | ||||||
 |
| |||||
| ||||||
#25projectsofchristmas
A cooker hood is a large fan that exhausts the air from the kitchen above the cooking stove. This is a good thing so that the smells and haze does not spread throughout the apartment. When this exhaust fan sucks air out of the kitchen, he creates a negative pressure. That's physics! And too low air pressure is dangerous for humans. Such exhaust fans make quite a lot of noise, so they must be powerful. And powerful fans can create a large negative pressure. Is my cooker hood able to create a dangerous negative pressure in my kitchen?
Spoiler alert: The answer is yes and no! But let's look at it in detail step by step:
First of all, you have to look at what point low air pressure would become dangerous. At sea level, the air pressure is about 1013hPa. At 2500m (8202ft) altitude the air pressure is only 747hPa. For averagely trained people, this is very rarely dangerous, but you might start to get short of breath. The atmospheric pressure on Mount Everest is only 314hPa. This is normally even for heavily trained people only possible to survive with special oxygen equipment.
Depending on the individual constitution, symptoms of altitude sickness can occur from as low as 700hPa. I live at 341m (1118ft) above sea level and the air pressure is on average 972hPa. So if my cooker hood is able to generate 270hPa of negative pressure, then I might experience symptoms of altitude sickness while cooking. I remember that last week when I was cooking mulled wine I started to get headache. I wonder if these were already the first symptoms of altitude sickness?
Let's measure itBarometric pressure is usually measured with a barometer. Therefore, it is logical to also measure the pressure difference in the kitchen with a barometer:
My living room barometer showed no difference when the exhaust fan was turned on or off. This could either mean that the fan generates very little negative pressure, or that my barometer cannot measure such kind of pressure changes. A digital solution with higher precision would be better.
The QMP6988 is a high precision air pressure sensor. He is used in the M5Stack ENV III unit and I have already used this sensor in my "M5ATOM ENV mini data monitor" project. The datasheet states that the sensor can measure a pressure range from 30kPa to 110kPa:
This corresponds to a range of +9000m (29527ft) to -500m (-984ft) above/below sea level. That should be enough to determine the potential risk in my kitchen. The absolute accuracy of the sensor is +/- 1hPa but the relative accuracy is significantly higher:
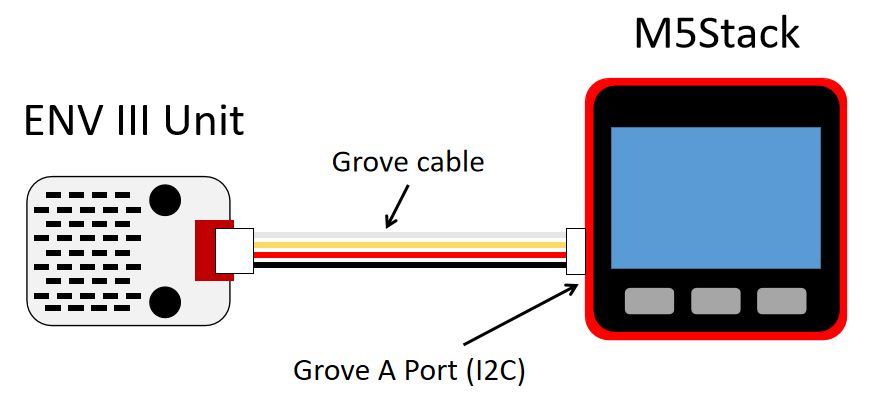
An relative accuracy of +/-0.039hPa, which corresponds to a height difference of 0.5m (1.6ft), should be fair enough to measure the effect of the fan in my kitchen. The sensor can be connected directly to the M5Stack with a Grove cable and is controlled via I2C. There is a library with which the reading of the values can be done very easily.
Let's say I measure the air pressure in my kitchen for a while without the exhaust fan running. Then I turn it on and measure the air pressure again for a certain time. And to make the measurement more accurate, I repeat this process. Then I would expect such a result:
Of course, all the windows and doors of the kitchen must be closed. Otherwise, air would immediately come in without the possibility of creating a vacuum in the kitchen. And of course, I expect the data to be much noisier than sketched.
I have written a firmware for the M5Stack, which writes the values of the air pressure sensor to the SD card every 250ms. Additionally I can use the buttons to indicate if the fan is on or off. This is also logged on the SD card. Here are a some screenshots of the software that shows how the data logging works:
Note: The screenshots are made with my M5Screen2bmp() function, which is described in this article.
How the code worksTo be able to connect to the ENVIII unit via I2C, first the library has to be included and then the objects have to be declared:
#include "UNIT_ENV.h"
// ENVIII:
// SHT30:   temperature and humidity sensor  I2C: 0x44
// QMP6988: absolute air pressure sensor     I2C: 0x70
SHT3X sht30;
QMP6988 qmp6988;
In the setup() function, a file name for the log file is created by incrementing an index until a name is found that does not exist on the SD card. In this way, a new file name is used each time the M5Stack is restarted.
char filename1[15];
// create a new filename that does not exist at SD
// Format:
// log_000.txt = first file
// log_001.txt = second file
// ...
// log_999.txt = last file!
strcpy(filename1, "/log_000.txt");
for (int i = 0; i < 1000; i++) {
filename1[5] = '0' + i/100;
filename1[6] = '0' + (i/10)%10;
filename1[7] = '0' + i%10;
// exit if filename does not exist
// !do not open existing, write, sync after write!
if (!SD.exists(filename1)) {
break;
}
}
// try to open the files for writing
log_data = SD.open(filename1, FILE_WRITE);
if(!log_data) {
M5.Lcd.setTextColor(TFT_RED,TFT_BLACK);
M5.Lcd.println("\nCould not create\n");
M5.Lcd.println(filename1);
while(true){
delay(100);
}
}
M5.Lcd.println("\nWriting data to ");
M5.Lcd.println(filename1);
The QMP6988 sensor is then initialized and switched to high precision mode:
if(qmp6988.init()==1){
Serial.println("[OK] QMP6988 ready");
}
qmp6988.setFilter(QMP6988_FILTERCOEFF_32);
qmp6988.setOversamplingP(QMP6988_OVERSAMPLING_32X);
qmp6988.setOversamplingT(QMP6988_OVERSAMPLING_4X);
The loop() function will look at each pass to see if the 250ms time interval has passed. Then a value is fetched from the sensor, displayed on the screen and stored on the SD card. In addition to that, the buttons of the M5Stack are checked on each pass of the loop() function. If the left button is pressed, then the state flag is set to "FAN OFF" and the counter for displaying the measured values is reset. The right button does the same for "FAN ON".
The data are stored on the SD card so I can analyze it on my PC. I wrote an R script to analyze and visualize the data. The script is attached to this project and there is also a sample file on the github repository, so that you can analyze it yourself.
First measurementFor the first measurement, I placed the sensor on the kitchen worktop near the hotplate (see picture above). Then I measured 100 data points with the fan off and then 100 data points with the fan on at the highest power setting. I then repeated this four times. And here are the results:
The good news is that I didn't show any symptoms of altitude sickness during the measurement. However, the bad news is that the data show no effect of the fan. At least there is no visible change of the air pressure depending on the function state of the fan. On the other hand, a clear change in air pressure over time of 0.29hPa can be seen. This is a normal weather-related change in atmospheric pressure. Such changes can be easily up to 45hPa and sometimes even more. Just to get an impression of this value: 45hPa corresponds to a change in altitude of 388m (1273ft). The following graph shows the changes in atmospheric pressure over a period of 35 days in my home town:
The horizontal line indicates the air pressure at the height of my flat over sea level. The vertical line shows the day of the measurement in my kitchen. Clear to see why there is such a huge drift in the kitchen data.
Nevertheless, back to the measurement: Even if I calculate the average values of the individual measuring regions (fan ON / fan OFF) and look at them statistically, no effect can be found. The weather-related change overrides any measurable effect of the fan:
It looks like the cooker hood in my kitchen creates only a very small amount of negative pressure. That's reassuring, because then I won't have to worry about suffering from altitude sickness in the kitchen during cooking. However, this means that the headache I had last week while making mulled wine might have to have a different cause.
But even if it is only a slight negative pressure, it must still be measurable. Therefore, I placed the sensor directly under the cooker hood and repeated the measurement. This time with only 30 measurement points per fan state. I did this to minimize the influence of weather-related changes in atmospheric pressure.
This time, a correlation between fan state changes and measured pressure values can be found in the data:
Even in this data, there is still a slight drift over time: The values are continuously increasing. But because the duration of the measurement is shorter (30 instead of 100 measuring points) and the sensor is placed closer to the fan, an effect could be measured. If we now look at the changes in air pressure between each change in fan state, we end up with the following picture:
It can be clearly seen that the air pressure decreases when the fan is switched on and that it increases when the fan is switched off again. This is more in line with my expectations, but the absolute difference is just round about 1.2Pa. In other words: 0.012hPa. No wonder that my living room barometer was not able to display the change.
Third measurementTo measure the effect of the fan more clearly I connected the sensor with a tube directly to the bottom of the hood. A roll of paper towels fit perfectly:
The measurement was then performed again with 30 measured values for fan ON and fan OFF. The data now shows a clear and strong effect:
The results shows an absolute pressure difference of more than 0.4hPa (40Pa). This corresponds to a difference in altitude of round about 3.5m (12ft).
With such a small amount of negative pressure, the scenario that my cooker hood can cause altitude sickness becomes fictitious. And also a look at the data sheet of an cooker hood says that a maximum pressure of only 4hPa is generated at the best efficiency point:
It might have been wise to take a look at the data sheet beforehand, but measuring whether you can really cook without risk is always good - and fun!
So the value might be low but it can still become a dangerous value. Let me explain why:
The danger of negative pressureAnother look at the data sheet says that "Great care should be taken when using the cooker hood at the same time and in the same room or area of the house as another heating appliance which depends on the air in the room.".
In detail: If there is a stove, a fireplace or a gas or oil heating system in the apartment, which requires the room air for burning, then even a negative pressure of about 4Pa can become dangerous! The following picture shows how in such a case the toxic fumes can be sucked out of the fireplace into the room:
Therefore, one should always open a window when using an exhaust hood together with a fireplace. And to accurately determine the negative pressure in such a situation, a differential pressure measurement must be performed. One should never rely on the values of such a simple measurement like I did. You should always consult a chimney sweep. The relative accuracy of +/-3.9Pa of the QMP6988 is not sufficient to exclude such a dangerous situation. More accurate measuring instruments are needed. So be safe and ask an expert!
Real danger or an overstatement of the situation?Back to the initial question if my cooker hood would be able to create a dangerous negative pressure in my kitchen: YES, negative pressure can be dangerous if you have open fireplaces in your home. Then there is a risk of poisoning from smoke gases. But NO, there is no danger of altitude sickness.
FeedbackEven if the cooker hood is not suitable for altitude training for mountain trips, it was still very funny to measure the negative pressure in my kitchen with the ENVIII sensor. And I learned a lot, which was also a lot of fun.
I hope you also enjoyed this report...
Feel free to write me if you have questions or suggestions, I am happy about any message.
Regards,
Hans-Günther Nusseck


Comments