

Hardware components | ||||||
 |
| × | 1 | |||
 |
| × | 1 | |||
| × | 1 | ||||
 |
| × | 1 | |||
Software apps and online services | ||||||
| ||||||
At universities in the UK it is common in the final year to produce a final year project. These projects and accompanying write up normally account for a significant proportion of your final year grade and hence overall degree classification.
As it happens my final year project was based on detecting and monitoring gases inside buildings particularly CO2. This project was for a university partner company with the hope of turning my project into a salable product. As the project was completed literally in the last century, it was predominantly analogue with only a small element of FPGA used to drive and sequence the sampling.
Due to the Covid-19 crisis at the moment, more and more of us are spending time inside. As such the quality of air in our living and workspace is important, increased level of CO2 can result in feeling sleepy.
I thought an interesting project would be to go back and create a 21st century air quality sensor and this time I can do it all digitally and in programmable logic. I can even access the cloud and log data to the cloud to see longer term trends, rather than just an instantaneous value.
CO2 levels are normally measured in parts per million (ppm) depending on the air quality typical values are
- 200 - 400 ppm - typical ambient outdoor levels
- 400 - 1000 ppm - Indoor levels with good air circulation and exchange
- 1000 - 2000 ppm - Indoor levels where occupants may feel sleepy
- 2000 - 5000 ppm - Indoor levels with very poor air exchange and circulation. This will make struggle with concentration, increased heart rates and nausea.
- 40, 000 ppm - Risk of death
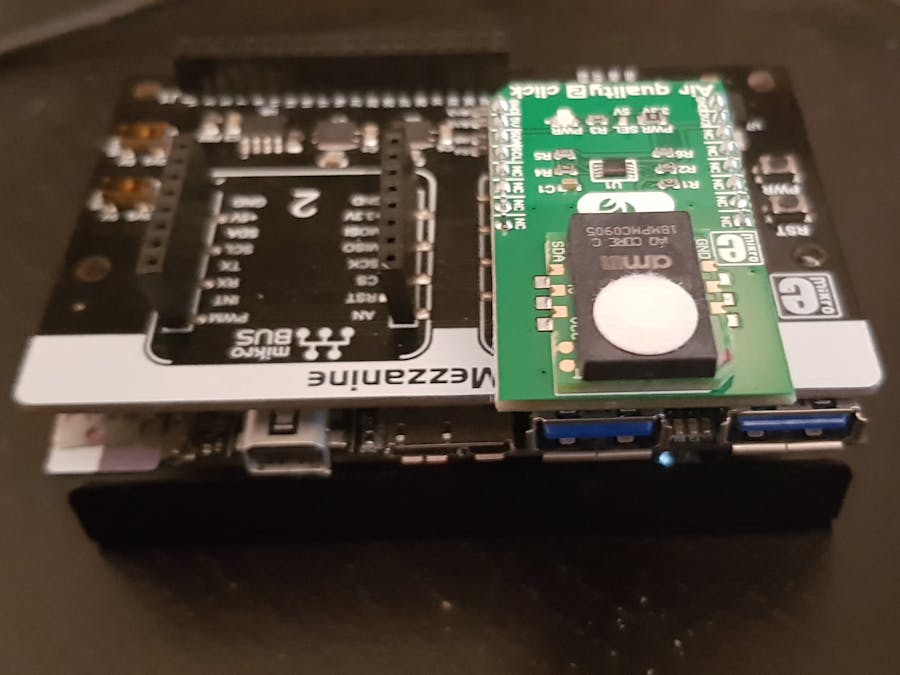
To create this project I am going to use the Ultra96V2, Click Mezzanine and the Click Air Quality 2 sensor. This click uses the iAQ-Core sensor to monitor the CO2 in the atmosphere, this sensor is MEMS based and is also capable of measuring TVOC.
TVOC is the Total Volatile Organic Compound and measured in parts per billion (PPB). Volatile Organic Compounds are also another indicator of indoor air quality.
As such we are going to log both CO2 and TVOC levels monitored by the sensor.
Setting Up PYNQThe first thing we need to do in this is download and flash a PYNQ 2v5 image to a SD Card.
To get started go to www.pynq.io/boards and download the Ultra96V2 V2.5 PYNQ image.
Unzip the downloaded compressed archive.
Burn the image to a SD Card using a program such as etcher.
Once the image is flashed insert it into the Ultra96 and power up the board.
To create the application we need to be able to communicate with the air quality two senor using I2C.
The sensor is different to I2C sensors that we have used in the past, the sensor we are using outputs nine bytes of information each a read is performed over the I2C bus.
As such there is no I2C register map which we need to write to first before we perform a read command.
In this instance we will be issuing a I2C read to the I2C address of the sensor and then reading nine bytes of information back from the sensor.
To be able to do this we need to install the smbus2 package on to the Ultra96v2, we can do this issuing the command
pip3 install smbus2This will download and install SMBus2 on to the Ultra96V2
We also need to download the drivers which enable us to communicate with io.adafruit.com which is my preferred cloud logging and visualisation platform.
Once we have both these packages installed we can assemble the electronics on the Ultra96V2.
ENSURE the Ultra96V2 is powered off and UNPLUGGED when you do this, connect the Air Quality Two sensor on to click one slot on the Click Mezzanine.
Then connect the Mezzanine, to the Ultra96V2 being careful to ensure pins do not get bent in the mating process.
Power on the Ultra96V2, now we will check the Air Quality Two sensor can be accessed over the I2C bus.
The Ultra96V2 uses a I2C mux to address different I2C buses both on board and using the Low Speed Connector. The on the Click Mezzanine, click position 1 is connected to I2C mux channel zero.
Which of the I2C adapters in the PYNQ system is connected to mux zero can be determined easily using a terminal. In the PYNQ environment open a new terminal window and enter the command
i2cdetect -lThis will list all the I2C adapters within the system, you will see I2C-2 is connected to the channel 0 on the mux.
We can then issue a command to determine if the Air Quality Two sensor is detected in the Click One position.
i2cdetect -r - y 2This will scan the I2C ports connected to mux channel zero, the address of the mux itself is 0x75 and the address of the Air Quality Two sensor is 0x5A
Now we can start to develop the application, the application will do the following
- Import the necessary SMBus2 and Adafruit IO packages
- Sample the sensor and extract the nine data words
- Check the sensor data is valid
- Extract the CO2 and TVOC measurements
- Plot the CO2 and TVOC measurements to the cloud.
To do this we will be developing our application in Jupyter Labs which is an evolution of the notebook environment.
We can access jupyter labs by opening the web address 192.168.3.1:9090/lab assuming you are connected to the Ultra96V2 as an Ethernet Gadget over USB.
The code for our application is
from smbus2 import SMBus, i2c_msg
from Adafruit_IO import Client
import time

aio = Client('NAME', 'USER')

i2c_bus = smbus2.SMBus(2)
Sensor_addr = 0x5a

msg = i2c_msg.read(Sensor_addr, 0x9)
i2c_bus.i2c_rdwr(msg)

data = list(msg)

while True:
    if (data[2] == 0x00):
        ppm_result = (data[0]*256) + data[1]
        tvoc_result = (data[7]*256) + data[8]
        aio.send('co2-internal', ppm_result)
        aio.send('tvoc', tvoc_result)
time.sleep(5)Once the application is written in the io.adafruit cloud we need to create two feeds one each for the CO2 and TVOC. The names of the feed, need to be identical to the ones used in our Python application.
Once we have the feeds updating from the PYNQ application we can then create a dashboard which enables remote visualization.
The first thing to do is add in a raw feed so we can see the raw feed values always updating.
The second thing we want to do is set up two indicators one each for the CO2 and the TVOC. Set these limits depending upon your expected safety levels.
The final thing to do is to add in graphs under the indicators so we can visualize the changes in CO2 and TVOC as they occur.
The final dashboard looks like below, pretty simple but very informative and able to be shared with who ever needs to know it.
In this project we have seen how we can create a system which will monitor our internal atmosphere and log this to a cloud functions so we can track trends and if necessary allow remote access.
See previous projectshere.
Additional Information on Xilinx FPGA / SoC Development can be found weekly onMicroZed Chronicles.


Comments