


Hardware components | ||||||
 |
| × | 2 | |||
 |
| × | 4 | |||
 |
| × | 1 | |||
 |
| × | 1 | |||
 |
| × | 2 | |||
 |
| × | 2 | |||
Software apps and online services | ||||||
| ||||||
 |
| |||||
 |
| |||||
| ||||||
This project was conceptualized when it became apparent that Tyler's roommate was stealing his food from the pantry. At first, he would just apologize and claim he would buy Tyler more food, but never did. Now, he just flat out denies it. So, in order to see when he is sneaking a snack of Tyler's, the Particle Photon motion sensor will track when the pantry door is open!
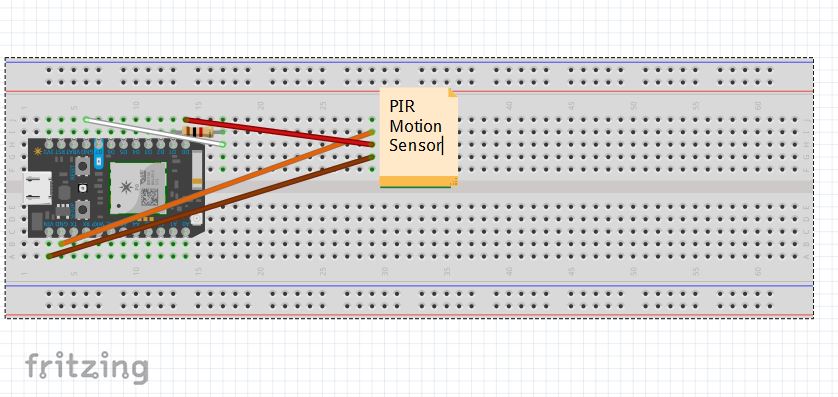
The first Photon is mounted in the kitchen pantry above the doorway so it will not be noticed. It has a PIR sensor attached to it which will see when the door is opened and a body is in the doorway. The positioning of the sensor is critical to make sure no other events in the kitchen are detected. This Photon will be programmed so that the internal LED at pin D7 would light up when motion is detected. This LED will allow us to know if the sensor is working properly.
The Photon was wrapped in a pop-tart box so that when the LED lit up detecting motion, the person in the pantry would not see the LED or be alarmed. Since there are no outlets in the pantry, the Photon was connected to a portable battery charger that was also wrapped in part of a pop-tart box to avoid detection.
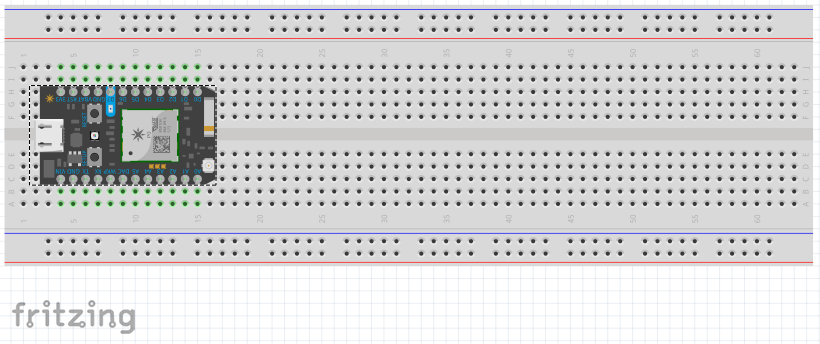
The Photon with the PIR sensor will publish events when motion is detected. These events will also be sent to the second photon. A notification will be sent to Tyler's iPhone alerting him that somebody is in the pantry and possibly stealing his food. He will be able to know what time the notification was sent so that he can figure out if he was in the pantry or if one of his roommates were. The second Photon is placed in Tyler's bedroom upstairs so that if he is in his room, the LED on pin D7 will light up alerting him someone is in the pantry.
The two Photons communicated with each other by the Particle.subscribe and Particle.publish functions. Tyler's Photon was subscribed to Melissa's Photon so that his Photon would send out a notification that motion has been detected in the pantry.
The IFTTT( If This Than That) app was used to send the notification. The code uses "intact" and "broken" to determine when motion is or is not detected. The numbers "1" and "0" were used for intact and broken so it would be easier to graph and understand that motion has been detected. Applets were created in IFTTT to send the data to Google Sheets to be graphed when motion is detected and when motion is not detected.
The applet for motion being detected used the event "1" which means the beam is intact and there is motion being detected by the motion sensor. Since Tyler's Photon was subscribed to Melissa's Photon, the device used in the applet was Tyler's Photon. The event of motion was sent to Tyler's Photon which allowed for his Photon to run the applet and send notifications.
The applet below was used to send a "0" to Google Docs/Sheets when the motion detected stops. This allowed for the motion data to be sent and graphed in Google Sheets as motion is detected. A name for a new Google Sheet was added in this applet so it would send the data there and start a new row every time data was sent to the spreadsheet. Another applet that is the same as the one below was used to send a "1" to Google Docs/Sheets when motion is being detected. This allowed for a graph to be created when motion is detected and when motion stops.
The motion detector was left above the doorway in the kitchen pantry. We recorded when Tyler went into the pantry so we would know when his roommates were in the pantry grabbing food. The value of "1" described when motion was detected. The value "0" described when there was no motion being detected. For example, if there was a flat line at 1 on the graph, that showed that there was constant motion for the time the line was flat and as soon as the line dropped to 0, was when motion stopped.
Tyler was recorded to be in the pantry at 9:50 pm and 11:21 pm. Every other time one of his roommates were in the pantry. As seen in the beginning of the graph, there is a constant blue spot which shows that there was constant motion in the pantry for that time range. When motion was detected, a spike was shown on the graph that motion was detected when no motion was detected for a while.
This graph is the same graph as the one with a larger time range. This graph allows for the constant motion to be seen and at what specific times motion was detected by the sensor. This graph is a better representation of motion being detected as it shows specifically when it was detected and how the values drop down to zero when there is no motion present.
Motion Sensor Photon 1


Comments