


Hardware components | ||||||
 |
| × | 1 | |||
Software apps and online services | ||||||
 |
| |||||
| ||||||
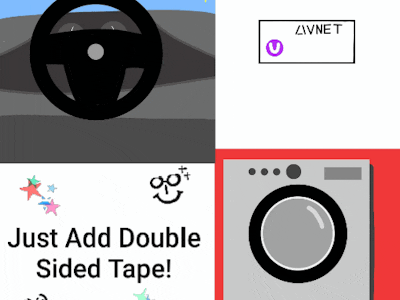
The Avnet SmartEdge Agile device is a self-sufficient smart device that can easily collect data by attaching to a steering wheel or to a dryer machine. The system is an all-in-one sensor collector and simple machine learning model execution stack.
Here, we present two simple applications and showcase how easy it is to jump from one application to the next one by just peeling and sticking the device using Velcro.
Driving monitoring has been a huge interest with two teenagers at home. It can also be important for reviewing the performance of drivers in parcel companies, grocery delivery services, share driving companies, taxis, reckless drivers, road rage drivers, and crazy drivers.
Repeating aggressive drivers would install one of these devices on their steering wheels and monitor their driving activity to prevent further violations.
We found motivation on our previous project: "GPS Drivers Log", which logs the GPS location and speed of the device, but does not record driving monitoring skills or environment conditions. The Avnet SmartEdge Agile works as a powerhouse sensor data collector that gives a profile of the driving conditions and skills of the driver.
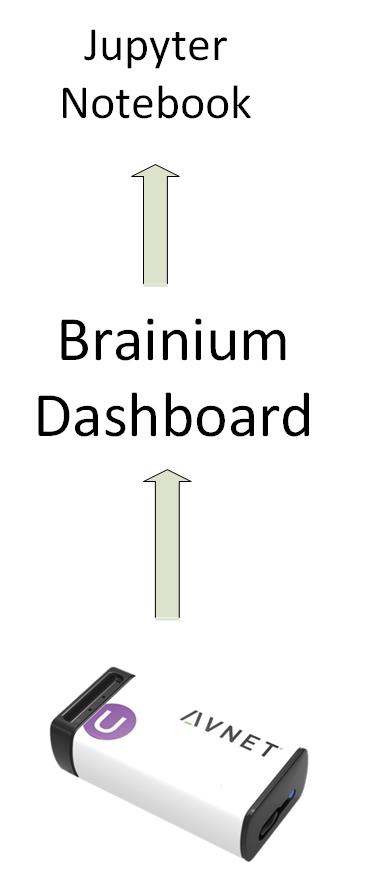
MaterialsWe use the Avnet SmartEdge Agile device. Yes, that's it. No other hardware needed.
A really good review about the Avanet SmartEdge Agile device can be found at "Brainium /SMARTEDGE AGILE - Review" written by gpearston. There is also the review title "Introduction to SmartEdge Agile and Brainium" by Krishnaraj Varma.
The Brainium Dashboard login is here and the documentation is here.
The jupyter notebook arrange plots horizontally functionality can be found here.
Jupyter notebook dynamic graph interaction explanation can be found here.
Interesting information we did not use this time. There is a gateway for RPi, you can find installation instructions here, the PDF can be download here.
Driving MonitorThe metrics available to create a driving profile are the gyroscope, world acceleration, and the proximity. The metrics that defines the car cabin environment are sound, temperature, and light.
Next are short descriptions of each metric.
Gyroscope, or angular velocity, shows how fast we steer. These include cases like avoiding an accident or suddenly changing lanes.
World acceleration, or normal acceleration, could show possible street racing or sudden deceleration.
Sound from loud music or chatting from passengers can be a huge distraction for a driver. New drivers tend to pump up the stereo music and could lose track of the surrounding traffic conditions or possible warning/danger traffic sound queues.
Light conditions varies depending on rural or urban driving roads.
Temperature control is an interesting area for energy savings. The device allows us to see the temperature setting inside the auto caving.
Humidity and pressure are dependent on the roads being driven. It is really interesting to see how the geological landscape changes the pressure conditions and therefore the engine performance.are dependent on the roads being driven. It is really interesting to see how the geological landscape changes the pressure conditions and therefore the engine performance.
The data collection was done by driving early morning starting at 5:00 am, a distance of 100 Miles and about 1:45 hours and afternoon starting at 3:30 pm during rush hour commute, a 100 Miles and about 2:30 hours. Yeap, a lot of data.
The data was collected by running the recording function on intervals of almost an hour, giving two files for the morning commute and three files in the afternoon. For instance the first file has this much data
GYROSCOPE_NORM                14119
WORLD_ACCELERATION_NORM        8824
ACCELERATION_NORM              8824
MAGNETIC_FIELD_NORM            8298
SOUND_LEVEL                    3525
PRESSURE                       3319
PROXIMITY                      3319
VISIBLE_SPECTRUM_LIGHTNESS     3319
HUMIDITY_TEMPERATURE           3319
IR_SPECTRUM_LIGHTNESS          3319
HUMIDITY                       3319
Name: dataSource, dtype: int64
The total number of data recorded is 63504 points on about 45 minutes of recording for this file, this took about 4.3 Mb of space.
Analyzing the data with Jupyter NotebookWe use Jupyter Notebook to analyze the data recorded by the Avnet SmartEdige Agile device. The file format received is as follows:
devicePublicId,dataSource,timestamp,scalar,vector
D1,GYROSCOPE_NORM,1566508292002,0.6946869492530823,
D1,GYROSCOPE_NORM,1566508292236,0.915907621383667,
D1,GYROSCOPE_NORM,1566508292471,0.39298704266548157,
D1,GYROSCOPE_NORM,1566508292783,2.0969412326812744,
D1,GYROSCOPE_NORM,1566508293017,0.35836511850357056,
D1,GYROSCOPE_NORM,1566508293251,0.5771657228469849,
D1,GYROSCOPE_NORM,1566508293485,1.3782867193222046,
D1,GYROSCOPE_NORM,1566508293797,1.8784273862838745,
D1,HUMIDITY,1566508292060,39,
D1,HUMIDITY,1566508293138,40,
D1,IR_SPECTRUM_LIGHTNESS,1566508292085,201,
D1,IR_SPECTRUM_LIGHTNESS,1566508293164,192,
D1,MAGNETIC_FIELD_NORM,1566508291973,57.30019760131836,
D1,MAGNETIC_FIELD_NORM,1566508292401,56.88837814331055,
D1,MAGNETIC_FIELD_NORM,1566508292834,54.180320739746094,
D1,MAGNETIC_FIELD_NORM,1566508293264,56.206783294677734,
D1,MAGNETIC_FIELD_NORM,1566508293698,54.03041076660156,
D1,ACCELERATION_NORM,1566508291924,9.627486228942871,
D1,ACCELERATION_NORM,1566508292315,9.70956802368164,
The header shows the file contents to be the deviceId, the datasource (sensor being reported), the timestamp (in milliseconds), the scalar (the sensor value) and vector (not currently used).
The timestamp was a little complicated to figure out the correct format. The value is not in seconds but in milliseconds. In Jupyter notebook you would do something like below where pd is the pandas package.
pd.Timestamp(timeStampVariableHere, unit='ms', tz='US/Eastern')We needed the following libraries to be installed in the Jupyter Notebook: pandas, matplotlib, io, base64, IPython, and ipywidgets. A sample session of the notebook used is attached to the program files section of the project.
import ipywidgets as widgets
import numpy as np
import pandas as pd
import matplotlib.pyplot as plt
import io
import base64
from IPython.display import display
from IPython.display import HTML
from ipywidgets import *
We started by loading the data using pandas
df1_1=pd.read_csv("DataPATH\\recording_session_5d5e5a275ba70e00014f9048.csv")
data_counts1_1 = df1_1['dataSource'].value_counts()
print (data_counts1_1)
The print shows the number of data points recorded per sensor as shown below
GYROSCOPE_NORM                14119
WORLD_ACCELERATION_NORM        8824
ACCELERATION_NORM              8824
MAGNETIC_FIELD_NORM            8298
SOUND_LEVEL                    3525
PRESSURE                       3319
PROXIMITY                      3319
VISIBLE_SPECTRUM_LIGHTNESS     3319
HUMIDITY_TEMPERATURE           3319
IR_SPECTRUM_LIGHTNESS          3319
HUMIDITY                       3319
Name: dataSource, dtype: int64
The following functions filter the data by using the label parameter, as in the example below. Setting the label to SOUND_LEVEL the prepareData function is called with a data range of point 500 to point 800. Pandas filters the data by means of the dataSource column and the selects the data range.
def getRangeData(data, columnLabel, dmin = 0,dmax = 0):
 if (dmin == 0 and dmax == 0):
     retdata = data[[columnLabel]]
 elif (dmin == 0):
     retdata = data[[columnLabel]][:dmax]
 elif (dmax == 0):
     retdata = data[[columnLabel]][dmin:]
 else:
     retdata = data[[columnLabel]][dmin:dmax]
 return retdata

def prepareData(label,dmin = 0,dmax = 0):
 global df1_1
 global data1_1
 global sdata1_1
 sdata1_1 = df1_1[df1_1['dataSource'] == label]
 data1_1 = getRangeData(sdata1_1,'scalar',dmin,dmax)


label ='SOUND_LEVEL'
prepareData(label,500,800)
The following is a set of graphs that depicts the driving profile of our first hour of morning driving.
You can notice that the Gyroscope_Norm shows some peaks at the beginning and end, these denotes city driving with hard and soft turns; the close to 0 part depicts highway driving with few change of lanes and almost no steering.
Notice also the environment metrics: temperature, sound and visible light. The sound source was radio news with average decibels of 55 dB. The cabin temperature gradually reduce to a comfortable 22 C, where the outside temperature was 26 C (a hot morning). Finally, early morning commute where sunrise has not happened, the light sensor is close to dark.
The afternoon commute is similar, with urban driving at the beginning and steady driving on highway. Proximity sensor corroborates few hard turns.
Noise levels also set to standard conversation and newscast. Temperature took sometime to reduce to 29 C. Light shows a considerable increase to an average of 800 with a peak during a sunny start and clouds afterwards.
Taking a closer look at the graphs with less number of points to graph. This is the sample after I pull out of the driveway and start my way thru the streets of our community. Notice that the lower peaks on the proximity sensor close to 2.5 cm match the change on the gyroscope which indicates in these cases a hard turn.
Same case for the afternoon commute, pulling out of work's garage.
Here is a small animation on how the gyroscope metric and the proximity sensor together shows a hard turn on the steering wheel. The proximity sensor changes value when turning the steering wheel and aligns with the signal know or the light rod. At that point we know the steering wheel has change at least 90 degrees which translates into a hard turn.
The higher the value on the gyroscope the drastic the turns is.
This graph displays together the Gyroscope_Norm (Blue) and the Proximity (Orange) sensor values. Notice the soft turn starting and then getting to a steering wheel turn of more than 90 degrees when the proximity sensor hits the light or wipers rod.
Below is another example, but this time notice the quicker changes on the gyroscope values, which suggest a hard turn (a fast motion of the steering wheel), as well as he proximity sensor changing more abruptly.
Finally, the following graph shows that when there is no turn the proximity sensor remains pointing to the center panel and no drastic changes on the gyroscope are recorded. This shows a highway driving.
Remember all these graphs were plot using matplotlib from Jupyter Notebook interface.
Driving AppThe driving App is under development and will notify of dangerous driving to the interested parties (parents, police, fire department, etc). The SmartEdge device will infer the possible danger situations arise by the driver actions and alert the driver and the aforementioned parties.
Are my clothes ready?Finally, just because we can, and it is so easy to preview live stream data. We attach the AVNET SmartEdge Agile device to our old dryer and run a spin cycle. As you can see from the below graph
Analyzing data from a steering wheel and a dryer machine are just the first steps in an endless array of possibilities on the applications of the Avnet SmartEdge Agile Brainum. With the data that can be collected including proximity, acceleration, angular velocity, light, and sound, we could use this information to apply it to the real world and conduct studies to make cars safer and everyday machines more convenient to use.
It would also be really useful if more metrics can be expose like ROTATION and MOTION, which we could not subscribe.
Finally the creation of AI models is left to the inference of defined rules using specific metrics, it would be a huge help if we could decide which metrics to use for training, as well as a analytic tool to find patterns on the raw data.
Thanks for reading.


Comments