


Hardware components | ||||||
_MsQPLY30wm.png?auto=compress%2Cformat&w=48&h=48&fit=fill&bg=ffffff) |
| × | 7 | |||
| × | 7 | ||||
| × | 7 | ||||
| × | 1 | ||||
 |
| × | 3 | |||
| × | 2 | ||||
| × | 9 | ||||
Software apps and online services | ||||||
 |
| |||||
| ||||||
| ||||||
| ||||||
| ||||||
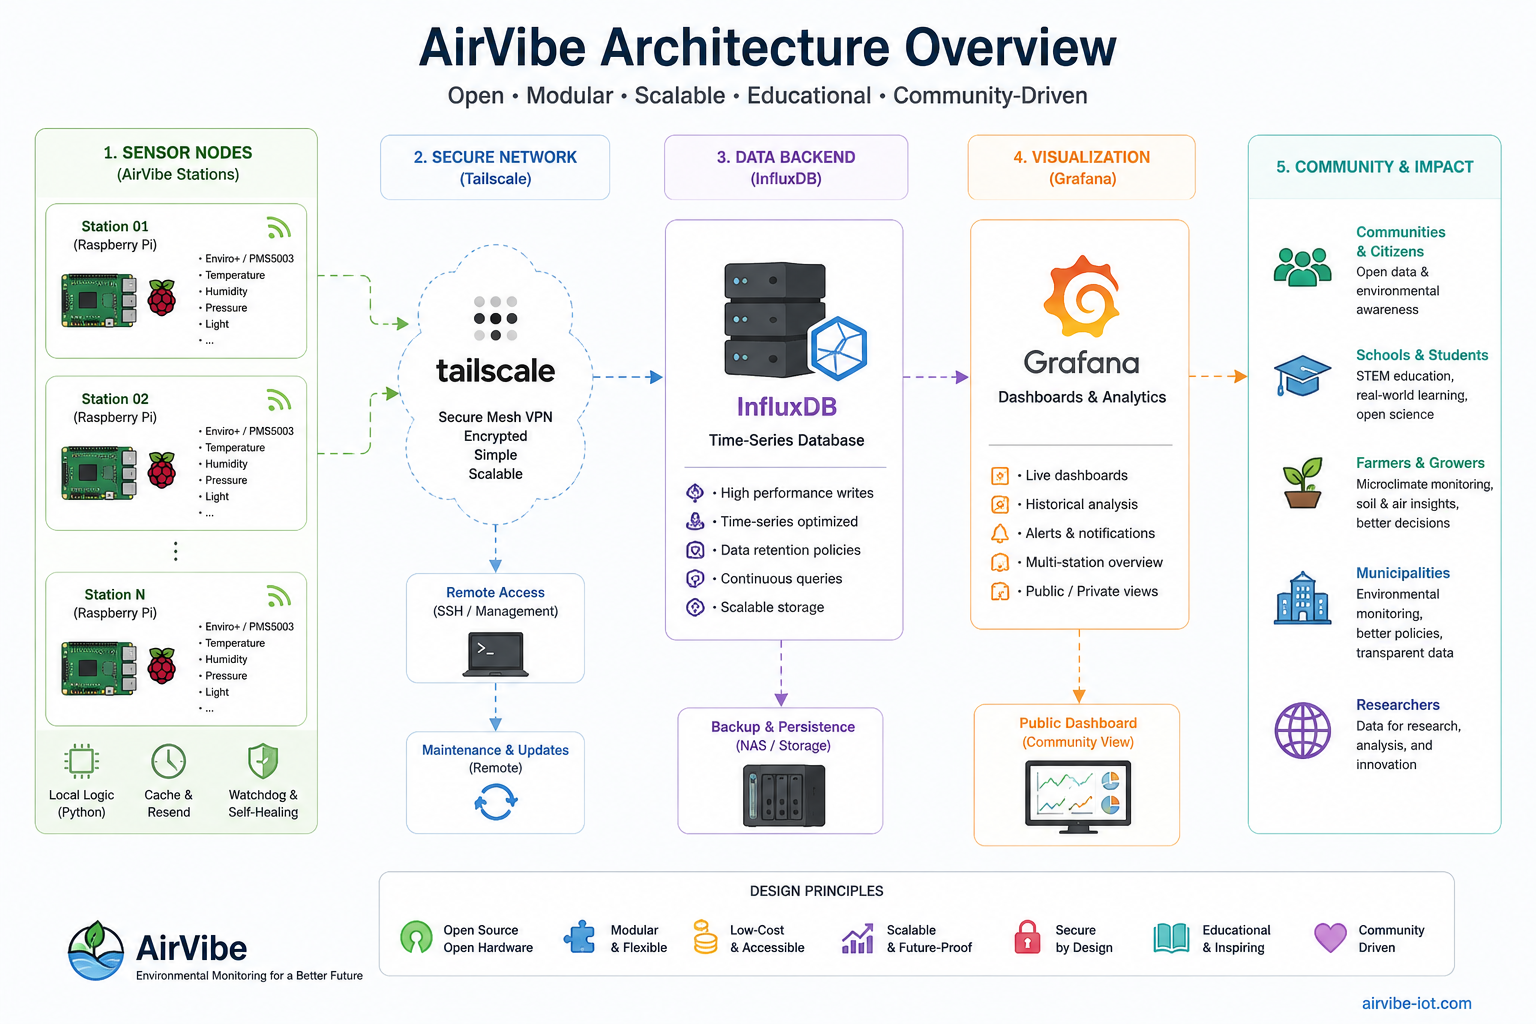
7 outdoor stations. A private VPN. Real data. Running 24/7.
The StoryI am an ecologist by training. My degree is in environmental sciences — I spent years studying ecosystems, reading air quality reports published by government agencies, and trusting numbers I had no way to verify independently.
At some point that bothered me enough to do something about it.
I did not want a dashboard. I wanted a network. Not one sensor on my balcony, but multiple stations at different locations — urban, rural, near a quarry, near a farm — all sending data to the same database, all comparable to each other.
The first station went live in April 2024 in Lancovo, a small village near Radovljica. By early 2025 the system had grown into something I had not fully planned: 7 active outdoor stations across Slovenia, a central InfluxDB instance on a Synology NAS, Grafana dashboards, and a Tailscale VPN connecting everything.
This is that project.
AirVibe is a distributed air quality monitoring network. Each station is a Raspberry Pi Zero 2W with a Pimoroni Enviro+ HAT and a PMS5003 laser particle counter, housed in a radiation shield and mounted outdoors. All stations send data every 15 seconds to a central InfluxDB 2 database via Tailscale VPN. Grafana visualizes the data in real time.
The network is live at airvibe.info. Code is at github.com/usektogo/airvibe-iot.
Each outdoor station uses:
- Raspberry Pi Zero 2W — main compute
- Pimoroni Enviro+ HAT — temperature, humidity, pressure, light, noise, gas (MICS6814)
- Plantower PMS5003 — particulate matter: PM1, PM2.5, PM10
- Stevenson screen (radiation shield) — weatherproof enclosure, airflow
- USB power supply — standard 5V
The Enviro+ connects directly to the Pi Zero GPIO. The PMS5003 connects via a ribbon cable to the HAT's PM connector. The whole assembly fits inside a 100mm radiation shield — the kind used in professional meteorological stations, available as a kit.
The Pi Zero 2W was chosen for its small size, low power draw (~1–2W), and sufficient performance for a Python data logging loop running every 15 seconds. There is no screen, no keyboard, no case beyond the shield. The station is headless and managed entirely over SSH via Tailscale.
This is where AirVibe differs from most single-sensor projects.
🌍 INTERNET
                             │
                    Cloudflare Proxy
                             │
                   +--------------------+
                   |   baseRapi         |
                   |   Raspberry Pi 5   |
                   |   - Nginx          |
                   |   - Grafana :3000  |
                   +--------------------+
                        │         │
              Tailscale VPN    Local LAN
                        │         │
         +--------------+    +------------------+
         |  Remote Pi   |    | Synology DS918+  |
         |  stations    |    | InfluxDB 2 :8086 |
         |  (7 nodes)   |    +------------------+
         +--------------+
The problem I had to solve: remote stations are in different locations with different ISPs. Some are behind routers with no port forwarding, one is behind a router that blocks certain mobile providers. I needed a way for all stations to reach the central InfluxDB reliably, without exposing it to the internet.
The solution: Tailscale.
Every station runs Tailscale. The central Raspberry Pi 5 (baseRapi) acts as a proxy — it receives InfluxDB writes on its Tailscale IP and forwards them via iptables NAT to the Synology NAS on the local network. From the perspective of every remote station, writing to InfluxDB is just an HTTP POST to a private IP. No credentials exposed, no open ports on the NAS.
bash
# iptables NAT on baseRapi — forwards Tailscale traffic to Synology InfluxDB
sudo iptables -t nat -A PREROUTING -p tcp --dport 8086 \
  -j DNAT --to-destination 1xx.xxx.x.xxx:8086
sudo iptables -t nat -A POSTROUTING -j MASQUERADE
Tailscale key expiry is set to Never on all nodes — this was a hard-learned lesson. An expired key looks exactly like a hardware failure: the station appears dead, logs stop, no error on the Pi itself. I lost several days of data before I understood this.
The 7 Active Stations- aq-off — Ljubljana (EIMV site) — urban outdoor
- aq-oms — Ljubljana OMS — outdoor, official environmental monitoring site
- aq-lan — Lancovo — outdoor, rural; first station, April 2024
- aq-kg1 — Kamna Gorica (farm) — outdoor, rural/agricultural
- aq-kg2 — Kamna Gorica (quarry) — outdoor, industrial proximity
- aq-mp — Polhov Gradec — outdoor, suburban/forest edge
- aq-po — Postojna — outdoor, most mature station
The Ljubljana OMS station is located at an official environmental monitoring site — which opens up an interesting future question: how much does a low-cost optical particle counter actually diverge from a professional reference instrument? That comparison is not the main goal, but the data will be there when I am ready to look.
Software — The Data PipelineEach station runs a Python script as a systemd service (Restart=always). The script loops every 15 seconds:
- Read Enviro+ (temperature, humidity, pressure, gas sensors)
- Read PMS5003 (PM1, PM2.5, PM10)
- Sanity check: if PM2.5 > 2000, discard (sensor error or startup artifact)
- Write to InfluxDB 2 via line protocol over Tailscale
python
# Core loop structure (simplified)
while True:
    try:
        env_data = read_enviro_plus()
        pm_data = read_pms5003()

        if pm_data["pm25"] > 2000:
            log("PMS5003 sanity check failed — skipping")
            time.sleep(15)
            continue

        point = build_influx_point(env_data, pm_data)
        _safe_write_point(client, point)

    except Exception as e:
        log(f"Error: {e}")
        cache_locally(point)  # write to local JSON cache

    time.sleep(15)
Local cache and resend: if InfluxDB is unreachable (network outage, Tailscale restart), the script writes the measurement to a local JSON file. On the next successful connection, it resends cached points and moves them to a quarantine folder if resend fails again. This prevents data loss during connectivity gaps.
Clock guard: on startup, the script checks if the system clock is plausible before writing. Raspberry Pi Zero has no RTC — on cold boot after a power outage, the clock starts at epoch until NTP syncs. Writing data with a timestamp of 1970 corrupts the InfluxDB time series. The clock guard holds the script in a wait loop until the time is valid.
python
# Clock guard — wait for NTP sync before writing
def clock_is_valid():
    return datetime.now().year >= 2024

while not clock_is_valid():
    log("Clock not synced, waiting...")
    time.sleep(10)
systemd service (/etc/systemd/system/aq_station.service):
ini
[Unit]
Description=AirVibe station logger
After=network.target time-sync.target

[Service]
ExecStart=/home/pi/.virtualenvs/pimoroni/bin/python /home/pi/station/log_to_influxdb.py
EnvironmentFile=/home/pi/station/.env
Restart=always
RestartSec=10

[Install]
WantedBy=multi-user.target
After=time-sync.target ensures the service does not start before NTP is ready. EnvironmentFile keeps all credentials and configuration out of the script itself.
Not all stations are equal. Postojna is the most mature — the station I build all others toward.
It has every reliability feature I developed over 14 months of running the network:
while Trueloop withRestart=always- EnvironmentFile for all config
- Local cache + resend + quarantine
- Clock guard (forward and backward)
_safe_write_point()wrapper around the InfluxDB writenormalize_fields_to_float()— prevents field type conflicts in InfluxDB- PMS5003 sanity check
After=time-sync.targetin systemd- Watchdog enabled
When I deploy a new station, I build it to the Postojna standard. When an older station has an outage, I upgrade it toward the Postojna standard. This is what 14 months of production failures teaches you.
One Recurring Pattern: The Pico W + socat ProxyTwo stations — Kamna Gorica (quarry) and Ljubljana OMS — use a Raspberry Pi Pico W for sensor reading. The Pico W is capable and cheap, but it cannot join a Tailscale network. This meant I needed a way to get data from the Pico W into InfluxDB without direct VPN access.
The solution: socat TCP proxy.
The Pico W sends data to the companion Zero's local IP. The Zero runs a socat listener that tunnels it through Tailscale to InfluxDB. Two small boards doing one job — inelegant, but reliable.
bash
# socat on Zero — forward local port to InfluxDB over Tailscale
socat TCP-LISTEN:8086,fork TCP:1xx.xx.xxx.xx:8086
This is not elegant. But it works, and it taught me that constraints force creative solutions that I would never have found otherwise.
Grafana DashboardsAll data lands in InfluxDB 2 (Flux queries) and is visualized in Grafana. Each station has its own bucket. Dashboards include:
- Geomap — all stations on a map of Slovenia, with live PM2.5 values
- Time series — PM1, PM2.5, PM10, temperature, humidity per station
- 24h gauge averages — at a glance daily exposure
- Wind rose (Plotly) — wind direction and speed at the OMS station
- Gas sensors — labeled as uncalibrated (MICS6814 requires calibration for absolute values)
1. The first hard problem is not the sensor — it's the network.Getting one Pi to read a sensor is a tutorial. Getting 7 Pis in 7 locations to reliably write to one database for months without manual intervention is a systems problem. Tailscale solved the network layer. systemd with Restart=always solved the process layer. The local cache solved the data integrity layer. Each layer took time to get right.
2. Time is surprisingly difficult.The Raspberry Pi Zero has no real-time clock. After every power outage, it wakes up in 1970. If your systemd service starts before NTP syncs, you get a beautiful continuous time series with a gap that contains data timestamped January 1, 1970. InfluxDB will accept this. Your graphs will not recover gracefully. The clock guard was the last thing I added and the most important.
3. Tailscale key expiry will ruin your day.Default Tailscale key expiry is 180 days. The key expires silently. The station appears offline. You assume hardware failure. You travel to the location. The Pi is running fine. Set key expiry to Never on all nodes. Write this in your documentation. Read it again.
4. Never delete data from InfluxDB to fix a field type conflict.If a field accidentally writes as a string instead of a float, InfluxDB rejects all future writes with the same field name. The temptation is to delete the measurement and start fresh. Do not. Create a new bucket. The data you have is real. You cannot get it back.
5. A reference standard matters more than coverage.I have 7 stations. Some are more reliable than others. The Postojna station is my reference — every feature I trust is tested there first. When I deploy a new station or upgrade an old one, I build toward that standard. Having a known-good reference is more useful than having 7 mediocre ones.
6. Sustainable field deployment is a design constraint.I travel to stations by e-bike, train, or on foot when possible. This is partly a personal value, partly practical — it means I think carefully about what requires a physical visit versus what I can fix remotely. A station that needs frequent physical attention is a failed design. Every improvement I make to remote manageability (Tailscale SSH, watchdog, systemd auto-restart, smart plug for remote reboot) reduces the carbon cost of the network.
What's Next- Multi-station Geomap combining all buckets in a single Grafana view
- Comparison analysis: low-cost PMS5003 readings vs. professional reference instruments at the OMS site
- SoilVibe — a parallel project measuring soil moisture, temperature, and light for small-scale farming and education (currently: basil experiment under LED grow light)
- 🌐 Live network: airvibe.info
- 💼 Portfolio: ukstudiolab.com
- 🐙 GitHub: github.com/usektogo/airvibe-iot
- ✉️ Contact: info@ukstudiolab.com
- ☕ Support the project: ko-fi.com/ukstudiolab
Built by an ecologist who wanted to measure, not just read reports :)


Comments