
Hardware components | ||||||
 |
| × | 1 | |||
| × | 1 | ||||
 |
| × | 1 | |||
 |
| × | 1 | |||
 |
| × | 1 | |||
 |
| × | 1 | |||
 |
| × | 1 | |||
| × | 1 | ||||
Software apps and online services | ||||||
| ||||||
 |
| |||||
| ||||||
| ||||||
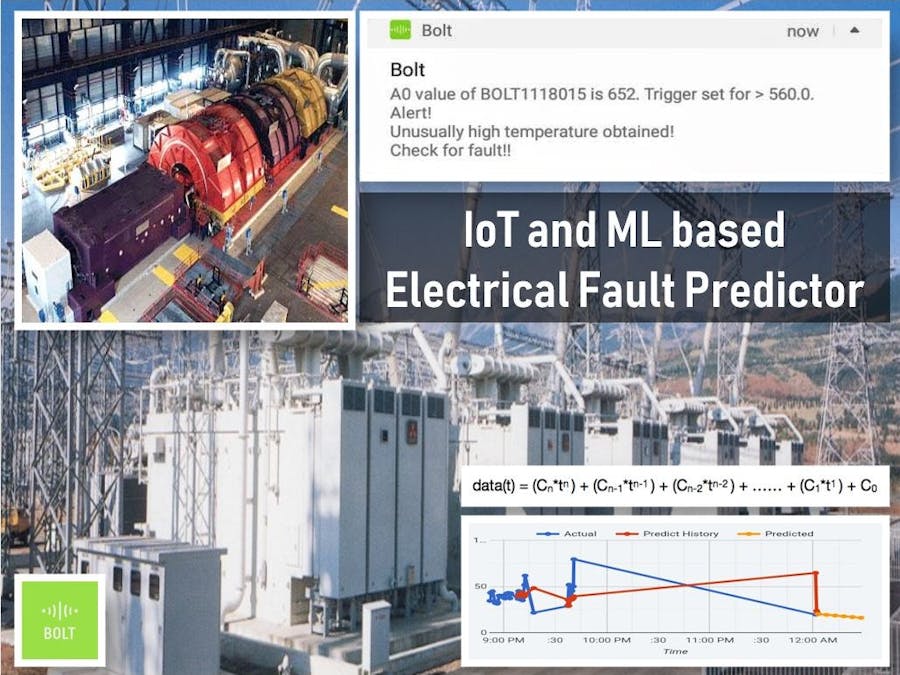
Power utilities, with their diverse assets, have to deal with the critical task of monitoring and maintaining their assets while functioning with increasing levels of efficiency and reliability. Through the utilization of predictive analysis and consequent maintenance technologies, power utilities can efficiently detect under performing assets and facilitate the operating personnel to discern factors leading to abnormal processes, and accordingly schedule maintenance activities. This early detection of any undesired operations enables power utilities to make use of the limited maintenance resources available more cost-effectively, maximize equipment up time, and boost quality and supply processes, eventually enhancing utilities’ economic position, brand value, and leading to increased customer satisfaction.With the advent of IoT or the Internet of Things, it is now feasible to transmit data directly to the Cloud, which makes it easily accessible from anywhere around the world with legitimate login credentials.
With the help Bolt IoT WIFI module, the temperature can be monitored and analysed from distant places. This eliminates the need for serial connectivity or the Ethernet and also provides multi-device access and condition-based alert notification at the same time.This project is a temperature monitoring and Predictive Fault Alert system that continuously monitors asset (transformer oil for transformer, winding for motors) temperature and gives out an alert via telegram, e-mail in case of a fault. (A fault, depending on its intensity can raise the ambient temperature significantly, and thus, the temperature is one of the crucial parameters to identify the fault). This project also provides provision for on-site LED glowing and Buzzer alarm for on-site system restoration and the immediate action of maintenance personnel. Finally, the project sends Android Push notifications immediately in case of a set temperature level breach.
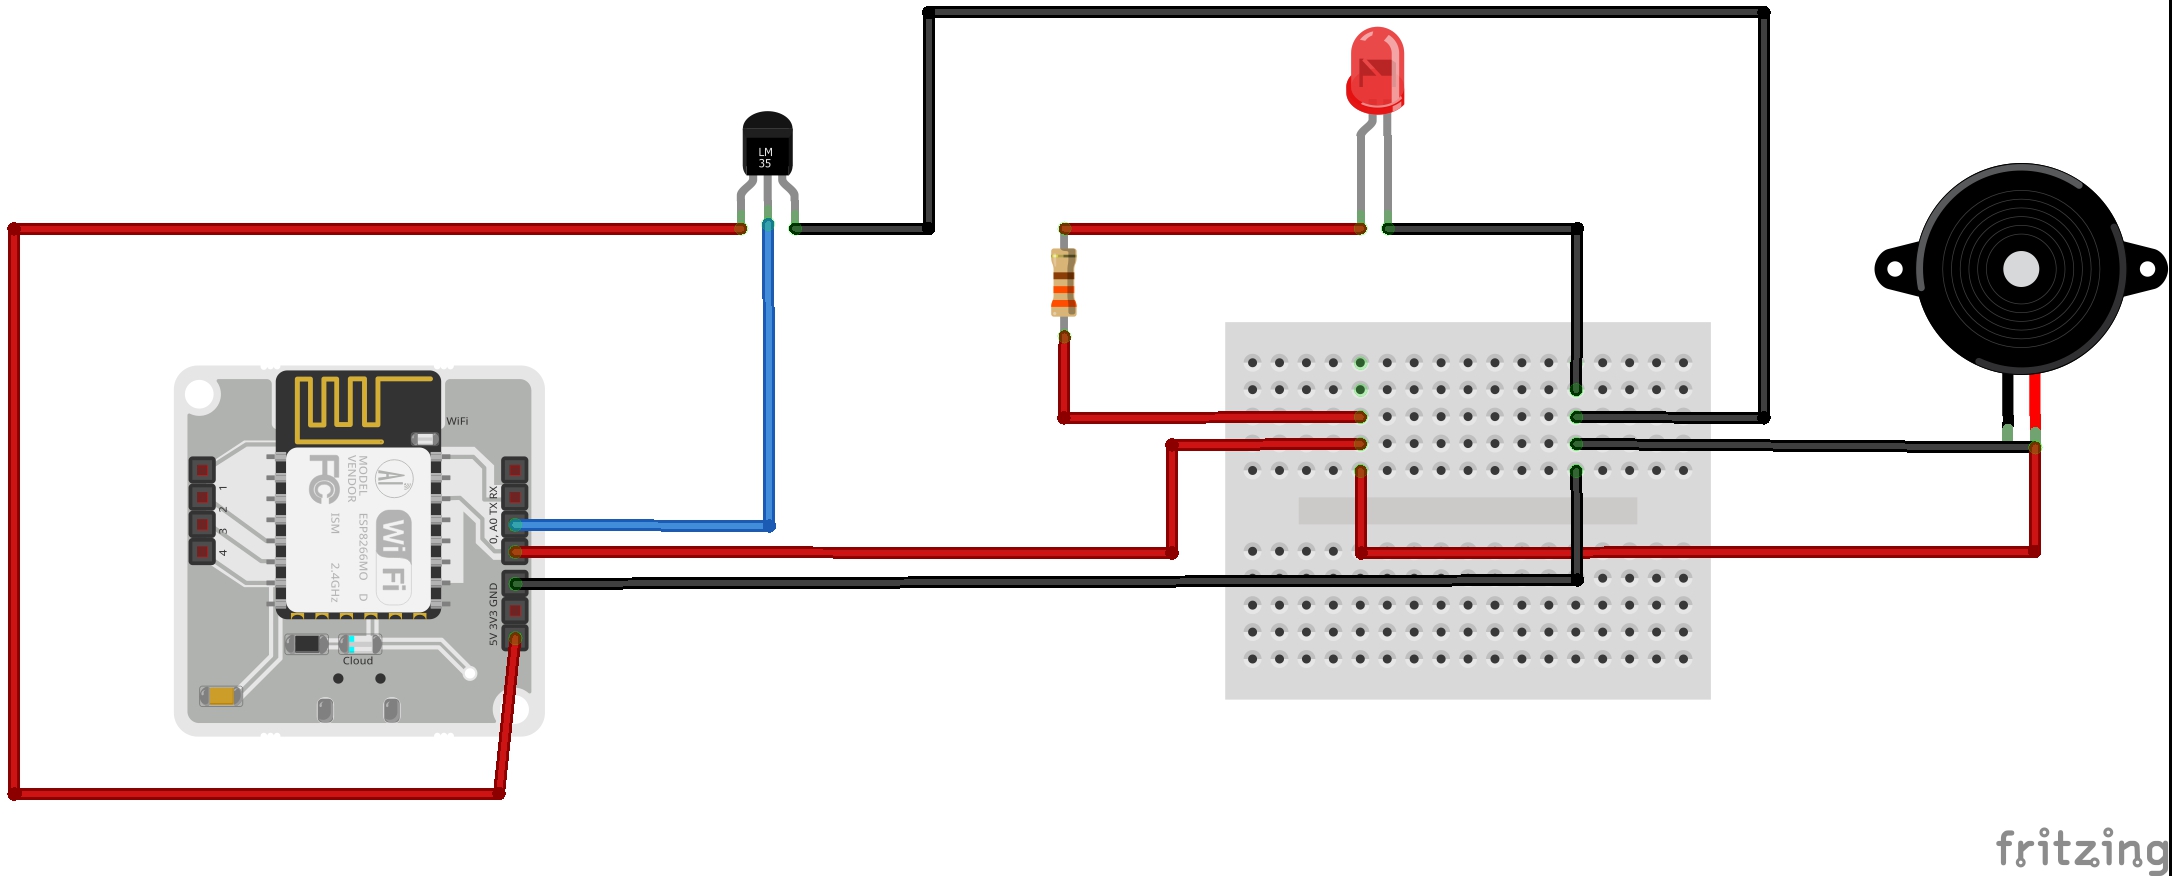
Hardware ConnectionsStep 1: The connection of LM35 with Bolt IoT WIFI Module can be accomplished in the following way (using male to female jumper wires) (refer Figure 1):
- GND (LM35)-GND (Bolt IoT WIFI Module)
- VCC (LM35)-5V (Bolt IoT WIFI Module)
- Output (LM35)-A0 (Bolt IoT WIFI Module)
Step 2: We take one leg of the resistor (330 Ohms) and wrap it around the longer leg of the LED i.e. positive leg. We then insert the negative leg of the LED into the ground pin of the Bolt. Finally, we insert the other leg of the resistor in digital pin 0 of the Bolt. We intentionally use a red LED to showcase the urgency of situation in case of a fault. (refer Figure 2)
Step 3: Piezo Buzzer Connections are similar to that of LED. But, unlike LED there is no requirement of resistor in series with the buzzer. The longer pin is the positive pin and the shorter one is the negative one. (refer Figure 3)
Step 1: Sign up/Sign in to the Bolt Cloud
Step 2: Link your Bolt Device to the Bolt Cloud using the Bolt App.
Step 3: Create a product on the Bolt Cloud of type GPIO Input.
Step 4: Configure the hardware to monitor the A0 pin, and give some variable name for it.
Step 5: In the code configuration, write the data visualization code (JavaScript Code) attached with this project.
Step 6: Save and Exit the product configuration.
Step 7: Link the Bolt Module to the newly created product.
Data Visualization: Plotting and PredictingStep 1: Previously, we made the required circuit connections, and created and deployed a Bolt Cloud product to monitor the temperature of an electrical equipment (refer Figure 4).
Step 2: Then, we used the monitored data to predict future values in the machine and accordingly perform maintenance for predicted fault or damage. (refer Figure 5)
The various parameters in the graph(plot) can be explained as:
Prediction points: This number tells the Visualizer how many future data points need to be predicted. By default, the Visualizer spaces the points with the data collection time in the hardware configuration of the product. So, if you set the product to collect data every 5 minutes, and select 6 prediction points, the Visualizer will predict the trend and show 6 points up to 30 minutes into the future.
No. Polynomial coefficients: Polynomial Visualizer processes the given input time-dependent data, and outputs the coefficients of the function of the form:
which most closely resembles the trend in the input data. This number tells the Visualizer how many elements should be present in the function i.e. the value of n.
Frame Size: These are the number of previous data points the Visualizer will use to predict the trend of the data. For example, if you set this value to 5, the Visualizer will use the previous 5 points to predict the trend.
Alert ConfigurationsStep 1: Switching on LED and Buzzer using API
LED and Buzzer are the main components for the on-site alarm for fault. Since the product on Bolt Cloud has been designed as GPIO Input (to obtain temperature sensor reading using pin A0), we need to use API and bolt device ID for LED and Buzzer Control via Python Code. (refer main Code section: Temp_Alert_Electrical_Equipment.py )
Step 2:Configure Push Alert on Bolt IoT App
The following details need to be configured for an alert.
- Alert Name
- The condition under which a notification should be sent.
- The kind of notification that has to be sent.
- The message that should be sent to you in case the alert is triggered by a device,
Step 3: Configure Mailgun Alert
Mailgun is an Email automation service. It has a very powerful set of inbuilt functions for sending emails. Developers can process their email with the help of Mailgun API. The algorithm(used in the main Code: Temp_Alert_Electrical_Equipment.py ) for sending an automated email using Mailgun is summarized as:
- Fetch the latest sensor value from the Bolt device.
- Check if the sensor value is in the range specified in the min and max values.
- If it is not in range, send the Email.
- Wait for 10 seconds. (Time of wait can be customized according to the need of the system.)
- Repeat the process again.
Once the complete system building was accomplished, the system was put in operation. The system started reading temperature and printing it on terminal(refer Figure 6) and alerts were successfully obtained via both Email and Android App (refer Figure 7 and Figure 8).
A short video that gives the project demonstration has been attached for better understanding of the project and the underlying thoughts and ideas.


Comments