
_xF0t4iaLPJ.jpg?auto=compress%2Cformat&w=40&h=40&fit=min&dpr=2)
Hardware components | ||||||
 |
| × | 1 | |||
 |
| × | 1 | |||
Software apps and online services | ||||||
 |
| |||||
Why I built it
Read moreI wanted to have a graphical representation of my room's climate to dig into some simple relations. For example: How does my daily life schedule affects temperature? Or is it bright enough to code?
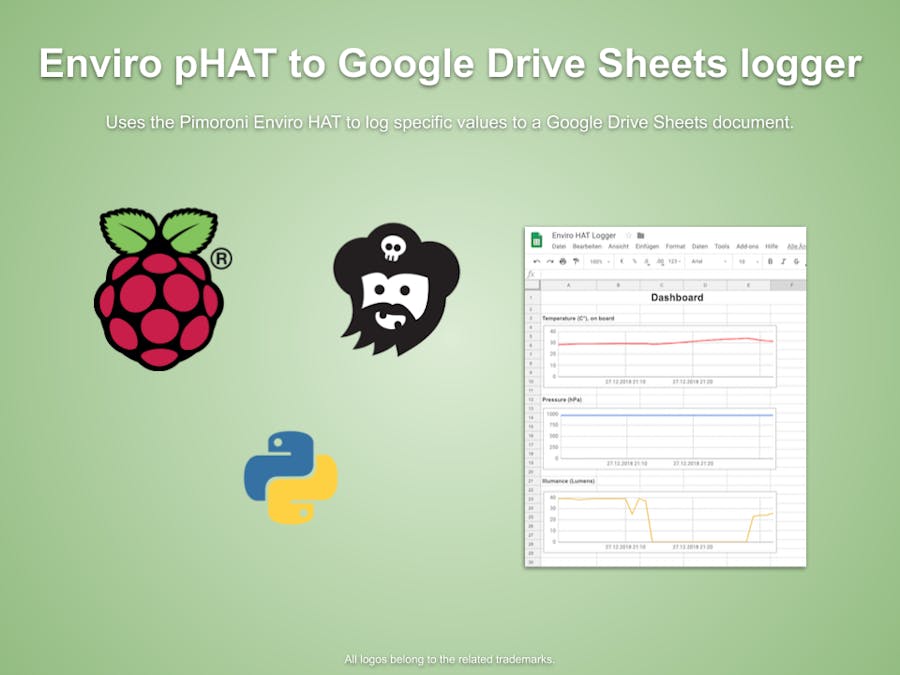
Keep things simpleThis simple script does not more as it have to do. I use the diagram feature of Google Drive Sheets to generate some nice looking graphs. There is no magic behind it.
Lesson learnedThe temperature sensor sits just a few centimeters above the Pi's CPU. That means. The temperature measurements are always way too hot. and should be only used as indicator for trends, not for actual values.,
_xF0t4iaLPJ.jpg?auto=compress%2Cformat&w=60&h=60&fit=min&dpr=2)
8 projects • 5 followers
Bavarian software engineer and community enthusiast who loves to play around with Raspberry Pis and IoT


Comments