

Hardware components | ||||||
 |
| × | 1 | |||
 |
| × | 1 | |||
 |
| × | 1 | |||
 |
| × | 1 | |||
Software apps and online services | ||||||
 |
| |||||
| ||||||
| ||||||
In this article, we will show how to use ESP-WROOM-32 to get real-time data from the air quality sensor and display it on the ThingsBoard dashboard. To send data to Thingsboard we will use ThingsBoard Arduino SDK.
PreparationArduino libraries:
- WiFi
- MQUnifiedsensor
- ThingsBoard Arduino SDK and dependencies:
- MQTT PubSub Client — for interacting with MQTT.
- ArduinoJSON — for dealing with JSON files.
- Arduino Http Client — for interacting with ThingsBoard using HTTP
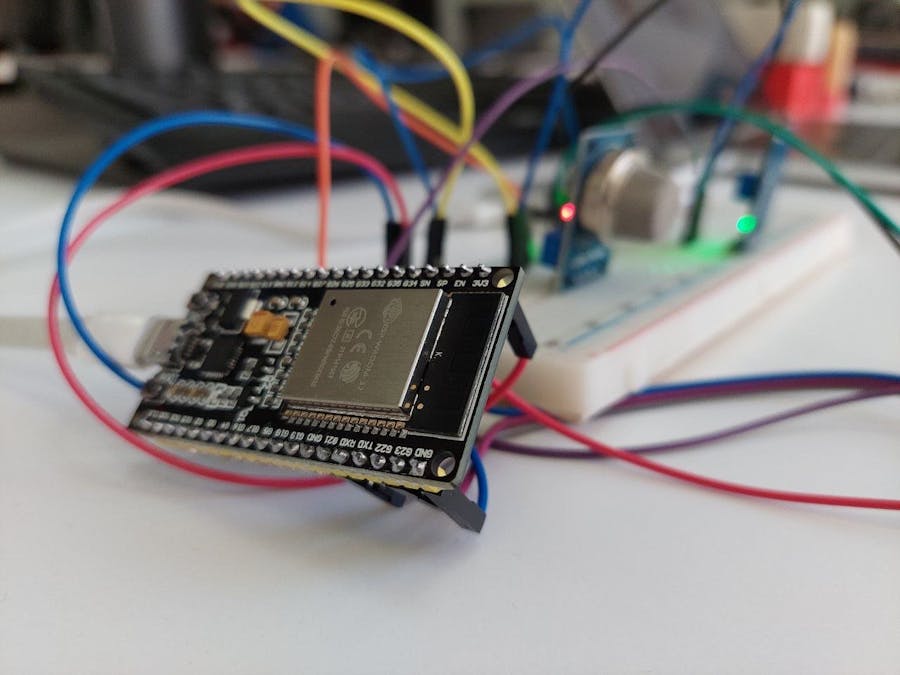
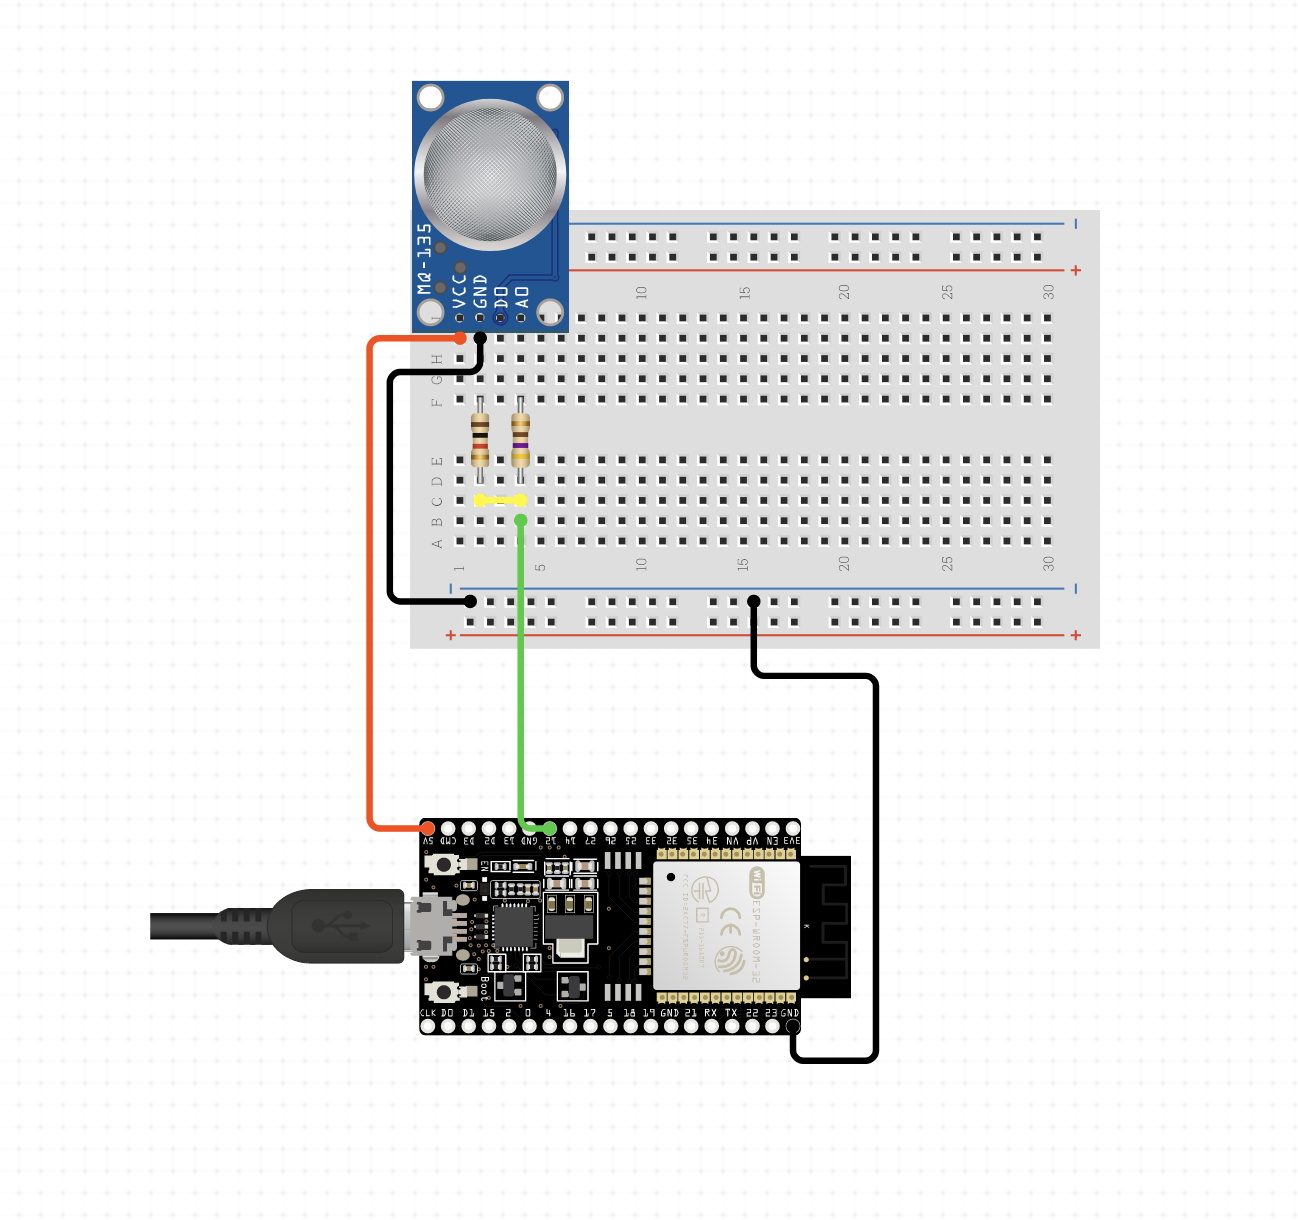
In the first step, we have to connect all required hardware.
The connection scheme is:
In order to start programming, we have to download all required libraries. To do this click on Tools > Manage Libraries... and in the Search input alternately install the following libraries:
Once the WiFi library is installed on the Arduino IDE, you can now add the header in code.
#include <WiFi.h>Define SSID and password values for your WiFi point:
const char* ssid = "YOUR_NETWORK_SSID";
const char* password = "YOUR_PASSWORD";
Optionally, with setup() function we start a connection to WiFi and start up Serial port for logging. Serial Monitor will give us some debug information and sensor data.
void setup()
{
    Serial.begin(9600);
    if(Serial) Serial.println("Serial is open");
    WiFi.begin(ssid, password);
    Serial.print("Connecting");
    while (WiFi.status() != WL_CONNECTED) {
        delay(500);
        Serial.print(".");
    }
    Serial.println();
    Serial.print("Connected, IP address: ");
    Serial.println(WiFi.localIP());
}
2.3 Collecting data from Air Quality sensor
To get data from the air quality sensor we use MQUnifiedsensor library. It is suitable for various MQ sensors.
So, we have to include the header on our sketch (below the WiFi library).
#include <MQUnifiedsensor.h>According to the official documentation of the library, we should define setting variables in the global scope:
Please review the documentation if using another MQ sensors to get define keys.
#define placa "ESP-32"
#define Voltage_Resolution 3.3
#define pin 34
#define type "MQ-135"
#define ADC_Bit_Resolution 12
#define RatioMQ135CleanAir 3.6
double CO2 = (0);
MQUnifiedsensor MQ135(placa, Voltage_Resolution, ADC_Bit_Resolution, pin, type);
Now proceed with setup() function section:
void setup()
{
    ...
    //Set math model to calculate the PPM concentration and the value of constants
    MQ135.setRegressionMethod(1); //_PPM =  a*ratio^b
    MQ135.setA(110.47);
    MQ135.setB(-2.862);
    // Configurate the ecuation values to get NH4 concentration
    MQ135.init();
    Serial.print("Calibrating please wait.");
    float calcR0 = 0;
    for(int i = 1; i<=10; i ++)   {
        MQ135.update(); // Update data, the arduino will be read the voltage on the analog pin
        calcR0 += MQ135.calibrate(RatioMQ135CleanAir);
        Serial.print(".");
    }
    MQ135.setR0(calcR0/10);
    Serial.println("  done!.");
    if(isinf(calcR0)) { Serial.println("Warning: Conection issue founded, R0 is infite (Open circuit detected) please check your wiring and supply"); while(1);}
    if(calcR0 == 0){Serial.println("Warning: Conection issue founded, R0 is zero (Analog pin with short circuit to ground) please check your wiring and supply"); while(1);}
    /*****************************  MQ CAlibration **************************/
    MQ135.serialDebug(false);
}
CO2 value calculation requires setA and setB functions added. Set 110.47 coefficient for A value and -2.862 coefficient for B value.
NB: Coefficients are specific to the sensor model, meaning that MQ-135 sensor's index mismatches MQ-4 sensor's, for instance.
To accomplish setup of CO2 monitoring within loop() function we must map the key:
void loop() {
    MQ135.update(); // Update data, the arduino will be read the voltage on the analog pin
    CO2 = MQ135.readSensor(); // Sensor will read CO2 concentration using the model and a and b values setted before or in the setup
    Serial.print("CO2: ");
    Serial.println(CO2);
    delay(5000);
}To send data to the ThingsBoard, we will use Arduino SDK that has all high-level functions for this.
3. Sending data into ThingsBoard Platform
To do this we have to define device token and ThingsBoard host:
#define TOKEN               "YOUR_TOKEN_TO_DEVICE"
#define THINGSBOARD_SERVER  "thingsboard.cloud"
// Initialize ThingsBoard client
WiFiClient espClient;
// Initialize ThingsBoard instance
ThingsBoard tb(espClient);
// the Wifi radio's status
int status = WL_IDLE_STATUS;
3.1 Obtaining the token.
If you have ThingsBoard up and running and corresponding to use case device entity exists:
- Go to Device Groups of the device owner, select All.
- Click on the device row in the table to open device details
- Click "Copy access token". The Token will be copied to your clipboard.
1. If using a PaaS subscription, Log in or Sign Up to the thingsboard.cloud and perform previous steps.
2. If you do not have any device entity so far, Create a new device:
a. At the left navigation bar click on Device groups > All
b. At the right top menu click on the + button
c. Fill in all inputs in the form
d. Click Add button
3. In the device list click on the created device
4. Click on Copy access token
5. Paste token to the global variable TOKEN
To send our decimal value from the sensor to ThingsBoard we should use sendTelemetryFloat() function in the main loop:
void loop() {
    ...
    if (!tb.connected()) {
        // Connect to the ThingsBoard
        Serial.print("Connecting to: ");
        Serial.print(THINGSBOARD_SERVER);
        Serial.print(" with token ");
        Serial.println(TOKEN);
        if (!tb.connect(THINGSBOARD_SERVER, TOKEN)) {
            Serial.println("Failed to connect");
            return;
        }
    }
    ...
}
The code above checks whether the client is connected to the ThingsBoard instance, and if not the client will try to reconnect to it.
Code ListingYou can find it in the attached files.
ResultWas this article useful? Place a comment below!


Comments