


Hardware components | ||||||
| × | 1 | ||||
| × | 1 | ||||
| × | 1 | ||||
 |
| × | 1 | |||
 |
| × | 1 | |||
 |
| × | 1 | |||
Software apps and online services | ||||||
 |
| |||||
| ||||||
In this project, I show you how to monitor and display your indoor and outdoor temperature, humidity and pressure using an Arduino Giga R1 WiFi, Arduino Giga Display, ProtoStax Enclosure, BME280 for indoor data and Open Weather Map for outdoor data.
We'll use LVGL to create a good looking graphical user interface (GUI), and the WiFi Client library and Open Weather Map APIs to query and display the outdoor data.
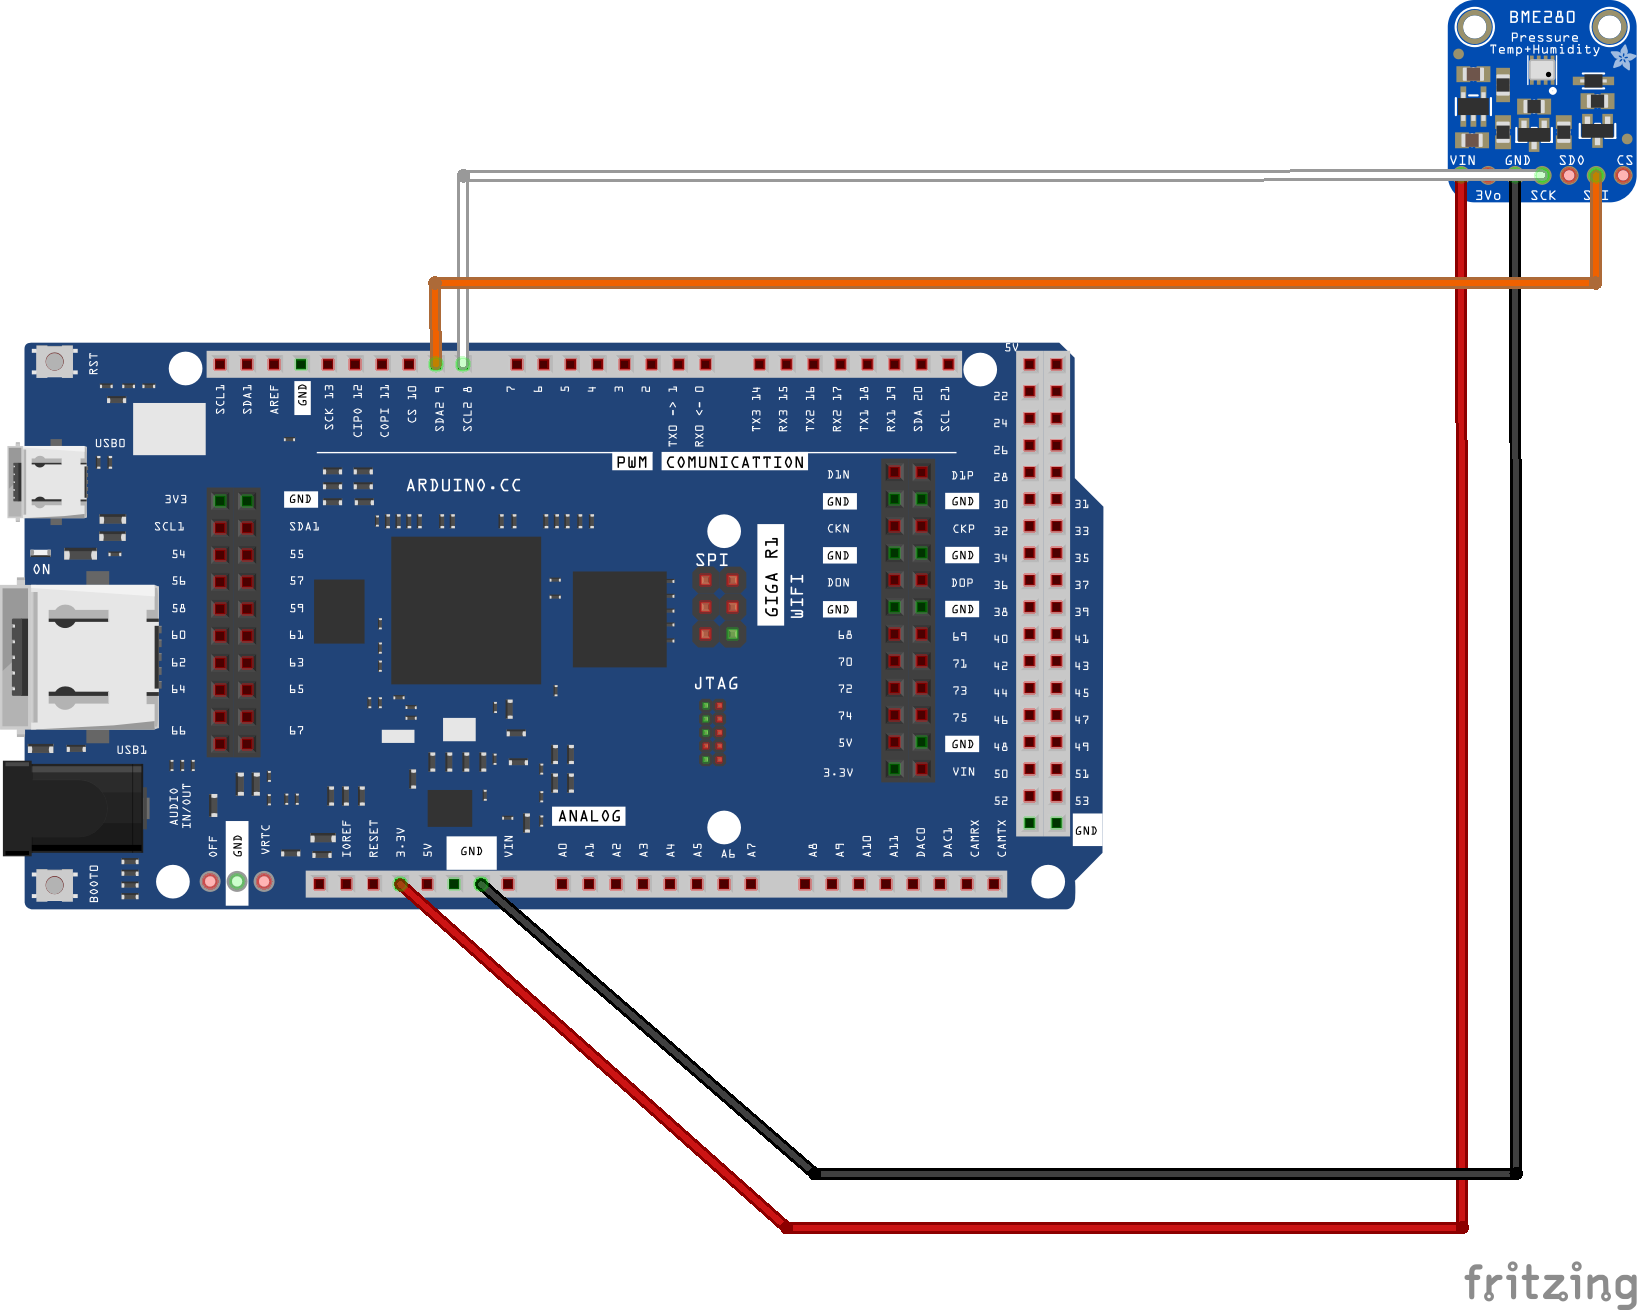
First step is to hook up the BME280 to the Arduino Giga R1 WiFi, and also make sure to attach its antenna.
I'm using I2C to communicate to the BME280 (either SPI or I2C is ok!) using the following connections:
Since the Giga R1 is a 3.3v system, I connect the VIN on the BME280 to 3.3v, so the logic levels are at the right voltage level.
The Giga R1 has 3 separate I2C buses:
- SDA - D20
- SCL - D21
- SDA1 - also available on the camera connector.
- SCL1 - also available on the camera connector.
- SDA2 - D9
- SCL2 - D8
I chose I2C2 - D8 and D9 pins for practical reasons. I'm using an Uno prototyping shield, which plugs in to only some of the pins, so I2C and I2C1 are not accessible, but I2C2 is!
I want the BME280 to measure the ambient temperature, humidity and pressure, so I also want to to be able to position the sensor near the periphery of the enclosure, so it is not affected by the heat generated by the board within the enclosure. I therefore did not solder the BME280 directly to the prototyping shield. Instead, I used a 7 position female-female jumper cable (the BME280 has 7 pins, though I only use 4 of them) like this one:
I removed the 3 wires I didn't need (using only position 1, 3, 4, and 6). I cut off the header on one side, and soldered those wires to the prototyping shield.
I then plugged in the BME280 to the female header – this gives me the flexibility to place the sensor anywhere within the enclosure (more on this later!)
Also make sure to plug in the external antenna (that came with the Arduino Giga R1 WiFi) into the antenna connector near the USB-C port.
To use the GIGA Display Shield, mount it on the bottom side of the GIGA R1 WiFi board. The GIGA R1 WiFi board will be flipped upside down when the display is used. See https://docs.arduino.cc/tutorials/giga-display-shield/getting-started/ for more details.
Here is the entire setup with the Arduino Giga Display, the Arduino Giga R1 WiFi and the prototyping shield. You can tape down the external antenna (it has sticky tape on one side) to the enclosure if you like - I just kept it free but positioned along the periphery.
I used double-sided tape to position the sensor near the periphery of the enclosure as shown.
The sensor is also close to the cable cutout of the enclosure side-wall, thereby ensuring better airflow and not being affected by the heat of the electronics itself.
However, you can go one step further and calibrate the sensor further, if you like! 😊
Step 4 - Install code and dependenciesGet the source code (link at the bottom):
git clone https://github.com/protostax/ProtoStaxAG_WeatherStation.gitInstall the dependencies (the code has been tested with the following versions):
- Arduino Mbed OS Giga Boards - version 4.3.1
The demos use the following libraries:
- LVGL (verion 9.3.0)
- Arduino_BMI270_BMM150 (version 1.2.1)
- Arduino_GigaDisplay (version 1.0.2)
- Arduino_GigaDisplayTouch (version 1.0.1)
- Adafruit BME280 Library (version 2.3.0)
- Adafruit BusIO (version 1.17.1) (dependencies for Adafruit BME280 Library)
- Adafruit Unified Sensor (version 1.1.15) (dependencies for Adafruit BME280 Library)
- ArduinoJson (version 7.4.2)
You can use the Arduino Library Manager to install the necessary libraries if not already installed
Arduino IDE->Sketch->Include LIbrary->Manage Libraries
If you're building using the arduino-cli, you can do the following:
cd ProtoStaxAG_WeatherStation
arduino-cli compile --profile arduinogigadisplay
which will install the necessary dependencies for the build. The build will fail because we need a few more things, so don't worry!
This demo uses Open Weather Map to get the outdoor temperature, humidity and pressure. You will need to get an API key for calling the service. Sign up and get your API key (free) at https://openweathermap.org/
Create an arduino_secrets.h and populate it with your WiFi SSID, password, and Open Weather Map API Key:
Define the following in your arduino_secrets.h file (create this file in this folder):
#define SECRET_SSID "YOUR_SSID"
#define SECRET_PASS "YOUR_WIFI_PASSWORD"
#define SECRET_OWM_API_KEY "YOUR_OWM_API_KEY"
We use a larger font size in this example. By default, only the font size 14 is enabled, so we need to go an enable the font size 28 we use in our sketch.
You will need to update lv_conf_9.h to enable LV_FONT_MONTSERRAT_28 (font size 28).
if you're using arduino-cli, update for following file (arduino-cli will give the exact location):
Library/Arduino15/internal/arduino_mbed_giga_4.3.1_30b02db2e5f51793/libraries/Arduino_H7_Video/src/lv_conf_9.hIf you're using the IDE to build, locate the lv_conf_9.h (the path will be something like this):
Library/Arduino15/packages/arduino/hardware/mbed_giga/4.3.1/libraries/Arduino_H7_Video/src/lv_conf_9.hIn the file, change
#define LV_FONT_MONTSERRAT_28 0
to
#define LV_FONT_MONTSERRAT_28 1
and build again. We use a bigger font size, and by default only font size _14 is enabled.
Also make sure to update the latitude, longitude and location fields in ProtoStaxAG_WeatherStation.ino to your location - otherwise you'll get the temperature, humidity and pressure for Mountain View, CA! 😊
Also update the timezone field to your appropriate one.
int timezone = -7; // Time zone - PDT - GMT - 7You can update the icons used to your own ones. You can use the LVGL image converter to convert your image to a c file that you can include here.
The temperature, humidity and pressure icon c files were created using that tool. I first created PNGs of size 100px x 100 px (from SVG using Inkscape) and used those with the LVGL image converter tool.
Once you have made the necessary changes (mainly enabling LV_FONT_MONTSERRAT_28 in lv_conf_9.h, adding arduino_secrets.h file with the appropriate values, and updating location, latitude, longitude and timezone in the sketch), you can build the code successfully,.
If everything works, you'll get a GUI with indoor and outdoor temperature, humidity and pressure data and the time.
There are a few nuances to bear in mind. Firstly, we use LVGL to create a grid display system, similar to CSS grid layout. We've created a two row, two column layout where the first row is much smaller than the second (where the main data is presented) - it shows the location and time. Even though we have two columns in the first row, we make the first column span 2, so there's not really a second column.
In the main display, we use a combination of images and labels to display the icons and the data.
We also use lv_timer functionality to periodically run code to fetch new data and update the appropriate labels. The timer for indoor data (and time) gets run every second, while the timer for the outdoor data is run every 60 seconds (outdoor data doesn't change as often, and there's no need to poll at a higher frequency and use up your free OWM bandwidth).
To communicate with OWM, we first need to connect to WiFi and get internet access. We connect to the specified SSID using the specified password (that you set in your arduino_secrets.h)
The OWM temperature data is by default returned in Kelvin, and we have conversion functions to convert to Centigrade or Fahrenheit. Alternately, you could add the preferred unit to the GET request in the API call. However, I decided to do the conversion on the Arduino itself, as I wanted the ability to switch between Celsius and Fahrenheit dynamically (without having to call the API again).
The Arduino Giga R1 WiFi also includes an RTC (real time clock) that we can set by reading the time from an NTP server when we've connected to the internet, and setting it on the RTC. In the lv_timer that runs every second, we poll the BME280 and also the RTC for the current time, and update the LVGL labels appropriately.
When reading the response from OWM, the read was happening too fast, and so it ended up thinking there was no more data, and so our result was getting truncated. To counteract this, I added a small delay and this resulted in the full response being read. Not the most satisfying fix (using delays to deal with timing issues), but it works!
while (client.available()) {
  char c = client.read();
  response += c;
  delay(1);
}
The Arduino Giga Display also has an on board RGB LED, and I've included code in the sketch to be able to set the color of the LED. You could use this for instance, to display a color code for temperature (or a computed color code for "wellness" - combining temperature, humidity and pressure). Show it as RED when it is too hot, and GREEN when the temperature is in the comfortable range, and BLUE when it is too cold, for instance! 😊 I leave that as an exercise for you!
Going ForwardOnce you get comfortable playing around with the code sample and understanding the code, it is always nice to try to extend your learning with doing more.
Here are a few suggestions on how you can take this project forward:
- Change the icons - get comfortable using the LVGL image converter tool to zhuzh up your icons and add your own personal touch!
- Add other sensors, such as a Particulate Matter (PM) sensor for even more data!
- Retrieve and show other data from Open Weather Map
- Update the GUI to accommodate all the extra data while keeping the interface clean
- Use the OWM One Call API version 3 - this is the latest version and the code here uses version 2.5.
- Use the OWM Geocoder API to convert from City, State, Country location to latitude and longitude that you can then use when calling the weather data APIs.
- Add buttons to switch from Celsius to Fahrenheit and other units
- Add LVGL charts to show the data over time
- Interface with actuators and/or services like IFTTT to take actions based on the temperature, humidity and pressure data, such as turning on a fan
- Can you think of other ways to extend this project? Share it with us in the comments below! 😊
Happy Making! 😊


Comments