


Hardware components | ||||||
 |
| × | 1 | |||
Every time you cook, your cooking almost always includes processed ingredients straight from the freezer or sealed packet. The fault of using processed or frozen ingredients lies not in the cooking style, but in the lifestyle. Fresh ingredients are always better for preparing healthy food, but we simply do not have the time to search for and buy fresh ingredients every day [1]. It may be worse since most of us will not track the date when we buy any food, and we also cannot differ the food if they were added on different dates. Thus, it is important to track the freshness of the food in the fridge.
GoalsThe goal of this project is to track the freshness of all foods in a fridge and make all these information available for a user by a smart phone. Figure 1 shows the basic idea of this project.
In the era of Internet of Things, huge amount of sensors will be deployed at everywhere we live. In the smart home concept, all appliances are connected to the Internet, and each of them will host different kinds of sensors. A smart fridge is a refrigerator which has been programmed to sense what kinds of products are being stored inside it and keep a track of the stock through barcode or RFID scanning. This kind of refrigerator is often equipped to determine itself whenever a food item needs to be replenished. In this project, we will leverage the barcode or RFID to collect the data of foods, including the date when it is added to the fridge, the category it is and the corresponding temperature, humidity, and storage time to keep it fresh. All these information will be stored in a gateway embedded in the fridge. This gateway is connected to the Internet via WiFi so that a user can view the food information on his/her smart phone. When any food is expired or needs to be replenished, the gateway also sends a SMS message to the user.
DesignBased on the aforementioned approach, we design the food management system that is illustrated in Figure 2. We plan to use RFID and barcode to collect the data. An Intel Edison board will serve as the gateway for data storage and user connection.
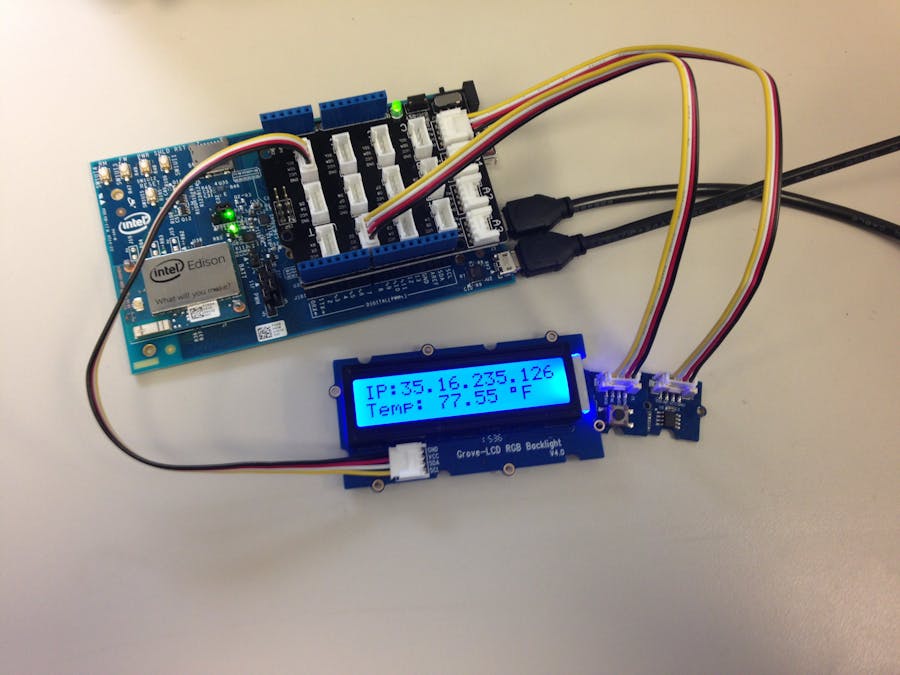
To show the capability of our system, we built a technical prototype to show our idea. In the implementation, we use the Seed Grove Starter Kit Plus, Intel Edison board, and a smart phone to build the system. We use a temperature sensor to simulate the data collection part. The temperature sensor is connected to the Intel Edison board and the data is also stored on the board. We create a service on the Edison board so that the user can connect to this board and check all data. To send the SMS message, we use Twilio as the SMS messaging server. If the temperature is higher than a threshold, the gateway will send a SMS message to user’s phone. On the client side, we created an application that shows the real-time temperature, which simulates the information browsing of the system. In Figure 3, it shows the hardware, application UI interface, and the SMS examples.
As shown in Figure 3, the temperature data can be collected in real-time fashion and showed in the LCD screen. The IP address are also showed on the LCD, which make it easy for user to connect. In the application, it will draw the temperature in a figure, where the green points means the temperature is lower than the threshold (i.e., 85 degree) while the red points means it’s higher than the threshold. When the temperature is higher than the threshold, the Edison board will send a SMS message to user’s phone, which includes the temperature. For more details of our project, please visit the hackster.io.
In the future work as shown in Figure 4, we plan to add the RFID and barcode scanning into the system. For the client application, we also plan to redesign it with the freshness view in which it shows the freshness of all foods in the fridge. For the SMS alert, we add the food information in the message and market information so that the user can choose to order it online.
[1] Food Freshness Technology. http://www.foodfreshnesstechnology.com/
[2] Internet Refrigerator. https://en.wikipedia.org/wiki/Internet_refrigerator
[3] Twilio. https://www.twilio.com/
[4] Project details on Hackster.io. https://www.hackster.io/silicon-clone-815f5c/smartcooler-c31346

Comments