


Hardware components | ||||||
_baVEVgguW1.jpg?auto=compress%2Cformat&w=48&h=48&fit=fill&bg=ffffff) |
| × | 1 | |||
 |
| × | 1 | |||
 |
| × | 1 | |||
Software apps and online services | ||||||
 |
| |||||
| ||||||
| ||||||
LinkedIn Profiles: Alfin Joji, Shilpa Joy
1. OverviewUrban plant watering aims at automating the plant watering in urban areas. Powered by an Arduino 101, it uses on-board tools along with a temperature sensors to calculate optimum conditions for watering plants in its own environment, and then waters the plant itself at the calculated time. We use LM35 temperature sensor to detect the current temperature. Soil moisture and rain sensors are optional currently we use only temperature sensors for this setup.
2. WorkFlowStep 1: When the device is first turned on, it will wait to set time as input.After setting in the time, the 101 will wait for 8 am, either the current day or the next.
Step 2: Upon reaching 8 am, the board will check to see if it has anything saved in the flash memory storage. If not, then it will go through the 14 hour temperature collection process using LM35 sensor and then classify the data and determine the optimum time, at which point it will repeat the collection cycle. If something is stored, then that data is used as the hour constant and cycles continue as normal.
Step 3: The collected values are stored in InfluxDB using an HTTP POST request. InfluxDB is used since its a time series database.
Step 4: The database is imported into Tableau software for visualization. It will helps to analyse the result in a graphical manner. We can easily identify the peak temperature time from the graph.
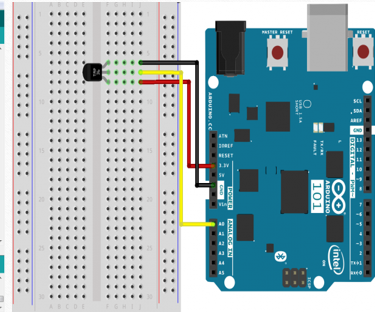
2.1 LM35 Temerature SensorLM35 is an easy to use temperature sensor. It have three pins Vcc, Out and Gnd. Pin 1 is connected to a power source ranging between 2.7 and 5.5 VDC. Pin 2 or Out is connected to an Analog input ( Arduino 101 contains 6 ADC pins, we can connect to any one of those pins). Pin 3 is connected to the ground of Arduino 101. Voltage on pin 2 range between 1 and 1.75V depending on the temperature.
The LM35 is a temperature sensor that operates like a thermometer, but with an electronic analog output. This output can be read by a device, such as a microcontroller, and converted to a temperature. In this project, the device attempts to calculate the optimum time for watering plants, which is closest to 25 degrees Celsius. It makes 30 records per hour, at intervals of two minutes, and at the end of each period calculates the average of 29 of these (excluding the first, as it usually is inaccurate).
float temp;
int tempPin = 0;
void setup()
{
 Serial.begin(9600);
}
void loop()
{
 temp = analogRead(tempPin);
 temp = temp * 0.48828125;
 Serial.print("TEMPRATURE = ");
 Serial.print(temp);
 Serial.print("*C");
 Serial.println();
 delay(1000);
}
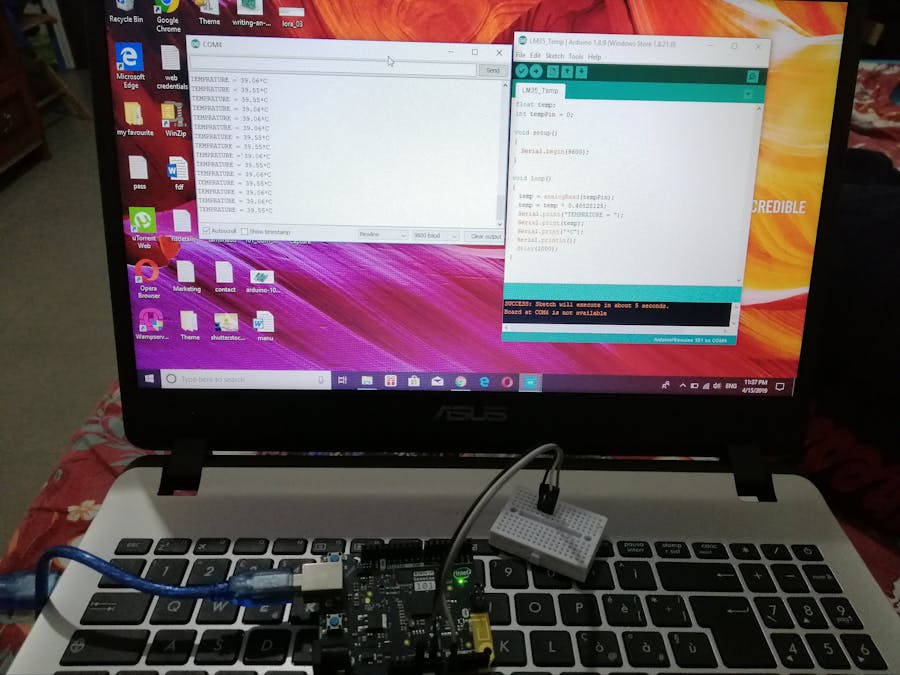
The image below shows how to setup the port and board connection in Arduino IDE. It is a software used for running the code that we written for an Arduino 101 board.
After connecting with the Arduino 101 we can upload the code into the board. And can run the Arduino IDE to display the result in Serial Monitor.
The Genuino 101 development board powered by Intel and developed by Arduino and Intel®, is a training tool for beginners in the field of electronics and programming. Experts will also be able to use the card to prototype IoT projects, such as wearable devices and smart home / leisure devices. Successor to the Arduino Uno model, the Genuino 101 card has additional functionality, low energy consumption Bluetooth (BLE), a six-axis accelerometer and a gyroscope.
Features and benefits of the Genuino 101 development board• Powered by the Intel® Curie ™ with two processors
microcontroller - 32-bit Intel® Quark ™
microcontroller -384 kB Flash memory
- 80 kB of SRAM
- DSP sensor hub
- Combined 6-axis sensor with accelerometer and gyroscope to support mobile use
- Bluetooth connectivity (GAP, GATT, DIS)
- Compatible with Windows, MAC OS X and Linux
- RTOS operating system in real time with continuous Intel development (available as open source in March 2016) -
Access to IDE Arduino for support during development
• Dual core architecture to speed up compilation
• 14 digital I / O pins
• 5 analogue pins
• 1 x USB port 1.1 for serial communication and upload sketch
• JTAG debug port
• Overvoltage protection
• Power jack
• ICSP connector with SPI signals
• Status
LEDs
- 1 Green LED on D13
- 1 Green LED for activity
- 1 Green LED for switching on
- 1 Red LED for any faults
• Dimensions: 70 x 55 x 20 mm
Intel Curie ArchitectureARC core executes the program to develop and communicates with X86 processors. X86 take care of Bluetooth Low Energy(BLE) and USB Connectivity. BLE is used for low power devices. Bluetooth Low Energy is intended to provide considerably reduced power consumption and cost. When the device is not sending any messages it turns to sleep mode. Here both the processors work simultaneously.
The Intel Curie PME, or pattern-matching engine, is an artificial neural network built into the Arduino 101. Its libraries are available on GitHub. Composed of 128 neurons, it is able to learn and classify data, saved in vectors, based on existing data, or vectors classified into categories. The more categories available, the more options for classification can be pursued by the PME.
For this project, the PME records temperature data over the course of a day and attempts to classify the optimum condition, 25 degrees Celsius, amongst this data. The result becomes the next day's time for watering the plant.
Data is recorded every hour from 8 am to 9 pm. The first time that this is done, the data will be saved onto the Onboard Serial Flash. This will allow the device to boot to a dataset even if it has been turned off. After obtaining the dataset, it attempts to classify the optimum conditions. If it is able to do so, then the category selected becomes the hour used for the next round. If not, then the device will use monthly constants, or the time of day each month that temperatures are highest. It should be noted that these aren't always the best temperatures for watering plants, which is why we utilized the PME.
After the first learning session, the data is cleared and relearned the next day, with the plant being watered at the chosen hour. This cycle repeats infinitely.
#include "CuriePME.h"
#include <CurieTime.h>
#include <SerialFlash.h>
#include <SPI.h>

#define thermometer  A3

int tm1;
int tm2;
int tm3;
int tm4;
int tm5;
int tm6;
int tm7;
int tm8;
int tm9;
int tm10;
int tm11;
int tm12;
int tm13;
int tm14;
int tm15;
int tm16;
int tm17;
int tm18;
int tm19;
int tm20;
int tm21;
int tm22;
int tm23;
int tm24;
int tm25;
int tm26;
int tm27;
int tm28;
int tm29;
int tm30;
int average;
int progav;
float voltage;
float temperatureC;
void setup() {
 if (!SerialFlash.begin(ONBOARD_FLASH_SPI_PORT, ONBOARD_FLASH_CS_PIN));

    if (central) { // If a device links to the board.
       setTime(hourTime, minuteTime, 00, dayTime, monthTime, 2017);
    }
    CuriePME.begin();
    const char *filename = "NeurData.dat";
    if (check_if_exists(filename) == true)
    {
       restoreNetworkKnowledge();
    }
    else
    {
       Serial.print("Not found!");
       delay(3000);
    }

    for (int i = 8; i < 22; i++)
    {
   voltage = analogRead(thermometer) * 3.3;
   voltage /= 1024.0;
   temperatureC = (voltage - 0.5) * 100 ;
   tm = map(temperatureC, -40, 125, 0, 255);
   tm1 = constrain(tm, 0, 255);
   delay(114000);

   voltage = analogRead(thermometer) * 3.3;
   voltage /= 1024.0;
   temperatureC = (voltage - 0.5) * 100 ;
   tm = map(temperatureC, -40, 125, 0, 255);
   tm2 = constrain(tm, 0, 255);
   delay(120000);

   voltage = analogRead(thermometer) * 3.3;
   voltage /= 1024.0;
   temperatureC = (voltage - 0.5) * 100 ;
   tm = map(temperatureC, -40, 125, 0, 255);
   tm3 = constrain(tm, 0, 255);
   delay(120000);

   voltage = analogRead(thermometer) * 3.3;
   voltage /= 1024.0;
   temperatureC = (voltage - 0.5) * 100 ;
   tm = map(temperatureC, -40, 125, 0, 255);
   tm4 = constrain(tm, 0, 255);
   delay(120000);

   voltage = analogRead(thermometer) * 3.3;
   voltage /= 1024.0;
   temperatureC = (voltage - 0.5) * 100 ;
   tm = map(temperatureC, -40, 125, 0, 255);
   tm5 = constrain(tm, 0, 255);
   delay(120000);

   voltage = analogRead(thermometer) * 3.3;
   voltage /= 1024.0;
   temperatureC = (voltage - 0.5) * 100 ;
   tm = map(temperatureC, -40, 125, 0, 255);
   tm6 = constrain(tm, 0, 255);
   delay(120000);

   voltage = analogRead(thermometer) * 3.3;
   voltage /= 1024.0;
   temperatureC = (voltage - 0.5) * 100 ;
   tm = map(temperatureC, -40, 125, 0, 255);
   tm7 = constrain(tm, 0, 255);
   delay(120000);

   voltage = analogRead(thermometer) * 3.3;
   voltage /= 1024.0;
   temperatureC = (voltage - 0.5) * 100 ;
   tm = map(temperatureC, -40, 125, 0, 255);
   tm8 = constrain(tm, 0, 255);
   delay(120000);

   voltage = analogRead(thermometer) * 3.3;
   voltage /= 1024.0;
   temperatureC = (voltage - 0.5) * 100 ;
   tm = map(temperatureC, -40, 125, 0, 255);
   tm9 = constrain(tm, 0, 255);
   delay(120000);

   voltage = analogRead(thermometer) * 3.3;
   voltage /= 1024.0;
   temperatureC = (voltage - 0.5) * 100 ;
   tm = map(temperatureC, -40, 125, 0, 255);
   tm10 = constrain(tm, 0, 255);
   delay(120000);

   voltage = analogRead(thermometer) * 3.3;
   voltage /= 1024.0;
   temperatureC = (voltage - 0.5) * 100 ;
   tm = map(temperatureC, -40, 125, 0, 255);
   tm11 = constrain(tm, 0, 255);
   delay(120000);

   voltage = analogRead(thermometer) * 3.3;
   voltage /= 1024.0;
   temperatureC = (voltage - 0.5) * 100 ;
   tm = map(temperatureC, -40, 125, 0, 255);
   tm12 = constrain(tm, 0, 255);
   delay(120000);

   voltage = analogRead(thermometer) * 3.3;
   voltage /= 1024.0;
   temperatureC = (voltage - 0.5) * 100 ;
   tm = map(temperatureC, -40, 125, 0, 255);
   tm13 = constrain(tm, 0, 255);
   delay(120000);

   voltage = analogRead(thermometer) * 3.3;
   voltage /= 1024.0;
   temperatureC = (voltage - 0.5) * 100 ;
   tm = map(temperatureC, -40, 125, 0, 255);
   tm14 = constrain(tm, 0, 255);
   delay(120000);

   voltage = analogRead(thermometer) * 3.3;
   voltage /= 1024.0;
   temperatureC = (voltage - 0.5) * 100 ;
   tm = map(temperatureC, -40, 125, 0, 255);
   tm15 = constrain(tm, 0, 255);

   // Similarly take values till tm30
   tm1 = map(tm1, 0, 255, -40, 125);
   tm1 = constrain(tm1, -40, 125);
   tm2 = map(tm2, 0, 255, -40, 125);
   tm2 = constrain(tm2, -40, 125);
   tm3 = map(tm3, 0, 255, -40, 125);
   tm3 = constrain(tm3, -40, 125);
   tm4 = map(tm4, 0, 255, -40, 125);
   tm4 = constrain(tm4, -40, 125);
   tm5 = map(tm5, 0, 255, -40, 125);
   tm5 = constrain(tm5, -40, 125);
   tm6 = map(tm6, 0, 255, -40, 125);
   tm6 = constrain(tm6, -40, 125);
   tm7 = map(tm7, 0, 255, -40, 125);
   tm7 = constrain(tm7, -40, 125);
   tm8 = map(tm8, 0, 255, -40, 125);
   tm8 = constrain(tm8, -40, 125);
   tm9 = map(tm9, 0, 255, -40, 125);
   tm9 = constrain(tm9, -40, 125);
   tm10 = map(tm10, 0, 255, -40, 125);
   tm10 = constrain(tm10, -40, 125);
   tm11 = map(tm11, 0, 255, -40, 125);
   tm11 = constrain(tm11, -40, 125);
   tm12 = map(tm12, 0, 255, -40, 125);
   tm12 = constrain(tm12, -40, 125);
   tm13 = map(tm13, 0, 255, -40, 125);
   tm13 = constrain(tm13, -40, 125);
   tm14 = map(tm14, 0, 255, -40, 125);
   tm14 = constrain(tm14, -40, 125);
   tm15 = map(tm15, 0, 255, -40, 125);
   tm15 = constrain(tm15, -40, 125);
   tm16 = map(tm16, 0, 255, -40, 125);
   tm16 = constrain(tm16, -40, 125);
   tm17 = map(tm17, 0, 255, -40, 125);
   tm17 = constrain(tm17, -40, 125);
   tm18 = map(tm18, 0, 255, -40, 125);
   tm18 = constrain(tm18, -40, 125);
   tm19 = map(tm19, 0, 255, -40, 125);
   tm19 = constrain(tm19, -40, 125);
   tm20 = map(tm20, 0, 255, -40, 125);
   tm20 = constrain(tm20, -40, 125);
   tm21 = map(tm21, 0, 255, -40, 125);
   tm21 = constrain(tm21, -40, 125);
   tm22 = map(tm22, 0, 255, -40, 125);
   tm22 = constrain(tm22, -40, 125);
   tm23 = map(tm23, 0, 255, -40, 125);
   tm23 = constrain(tm23, -40, 125);
   tm24 = map(tm24, 0, 255, -40, 125);
   tm24 = constrain(tm24, -40, 125);
   tm25 = map(tm25, 0, 255, -40, 125);
   tm25 = constrain(tm25, -40, 125);
   tm26 = map(tm26, 0, 255, -40, 125);
   tm26 = constrain(tm26, -40, 125);
   tm27 = map(tm27, 0, 255, -40, 125);
   tm27 = constrain(tm27, -40, 125);
   tm28 = map(tm28, 0, 255, -40, 125);
   tm28 = constrain(tm28, -40, 125);
   tm29 = map(tm29, 0, 255, -40, 125);
   tm29 = constrain(tm29, -40, 125);
   tm30 = map(tm30, 0, 255, -40, 125);
   tm30 = constrain(tm30, -40, 125);
   // Find the arithmetic mean and commit it to memory.
   average = (tm2 + tm3 + tm4 + tm5 + tm6 + tm7 + tm8 + tm9 + tm10 + tm11 + tm12 + tm13 + tm14 + tm15 + tm16 + tm17 + tm18 + tm19 + tm20 + tm21 + tm22 + tm23 + tm24 + tm25 + tm26 + tm27 + tm28 + tm29 + tm30) / 29;
   commitSample(i, average);
 }
 saveNetworkKnowledge(); // Save this new data to flash memory.
}


void commitSample (int category, uint8_t s1)
{
 uint8_t vector[1];
 vector[0] = s1;
 CuriePME.learn(vector, 1, category);
}

void loop() {
 uint8_t vector[1];
 vector[0] = 25;
 int answer = CuriePME.classify(vector, 1 );
 if (answer == CuriePME.noMatch)
 {
   Serial.print("NO MATCHES!");
   if (month() == 1 || month() == 2 || month() == 11 || month() == 12)
   {
     answer = 12;
   }
   else if (month() == 3 || month() == 4 || month() == 10)
   {
     answer = 14;
   }
   else if (month() == 5 || month() == 6 || month() == 9)
   {
     answer = 15;
   }
   else if (month() == 7 || month() == 8)
   {
     answer = 16;
   }
 }
 else
 {

   Serial.print("Category:");
   Serial.print(answer);
 }
}
InfluxDB is a time series database. It is an open source application with Go language and it doesn't use an external dependecies.
It is designed to handle high write and query loads and provides a SQL-like query language called InfluxQL for interacting with data. InfluxDB, supports millions of writes per second, and can meet the demands of even the largest monitoring and IoT deployments.It provides write and query capabilities with a command-line interface, a built-in HTTP API requests by executing queries. InfluxDB offers an very intuitive user interface to interact directly with the dabatabase called Chronograf.
An example of the POST request is the follow:
curl -i -XPOST "https://marty-c9aef689.influxcloud.net:8086/write?db=smartplant&precision=m&u=xxx&p=xxx" --data-binary "temptable temperature=34"
The request specifies the endpoint url listening on port 8086 (default port of InfluxDB), the name of database used in write mode, the precision of timestamp (minutes), the username and password for the Oauth authentication and finally, it is specified the data about the temptable (Temperature) in a binary coding.
2.4 Tableau SoftwareTableau software is a data visualization software. It is easy to connect to any data source. Tableau is focused on one thing - helping people see and understand data. It allows for instantaneous insight for transforming data into interactive virtualization.
We have create a Web Data Connector (WDC) to connect InfluxDB and Tableau. It is a web page written in HTML and Javascript that allows a bidirectional connection between the two platforms, with a very intuitive interface.
Graph view in Tableau software:
2.5 Conclusion
This solution is designed to make urban plant irrigation simpler and more optimized by employing an automatic setup to take care of this.


Comments