

Hardware components | ||||||
 |
| × | 1 | |||
 |
| × | 1 | |||
| × | 1 | ||||
| × | 1 | ||||
| × | 1 | ||||
| × | 1 | ||||
Software apps and online services | ||||||
| ||||||
 |
| |||||
Hand tools and fabrication machines | ||||||
 |
| |||||
 |
| |||||
Many times a situation comes in life where we need to monitor or log a sensor's readings. Grandeur Canvas is a fantastic tool to visualize sensor data over the internet with very little effort.
Temperature and Humidity are two parameters which may indicate a lot about the ambience of a place. This project is about using an ESP8266 based ESP-01 Wi-Fi module to display temperature and relative humidity from a DHT-11 sensor on built-in widgets provided in Grandeur Canvas. This can be extended to other sensors as the method will be almost similar.
The Software Setup:Grandeur provides a backend where a virtual device-user pair is created. The device model is described upon creation as a JSON object containing various variables (temperature and humidity in this case) which can be read and written to. Grandeur Canvas is a web app that can be used to visualize the device state of paired devices using graphical widgets.
The code is provided in a GitHub repo. Following figure describes the flow of data:
The project requires following Arduino libraries:
The hardware setup:The project is setup on a small breadboard and it uses modules one on top of the other.
The ESP-01s module bears the brains and antenna to process and communicate data over Wi-Fi. It is inserted into a programmer adapter which contains a USB-to-TTL converter to connect ESP-01s module to a PC via UART interface. This can be used for debugging and with a little alteration it enables programming mode.
The headers on programmer adapter are stripped off and replaced with long headers. Then this adapter is inserted into the breadboard adapter. Three modules compounded together look like this: -
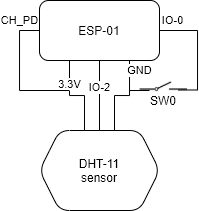
The ESP-01s Programmer Adapter can be used to program the module as well as retrieve debug info from a running program. To switch between programming mode and normal mode we just need to flip a switch as shown in following schematic:
The SW0 switch, when closed, makes IO-0 connect to ground and on boot-up the module goes into programming mode. Otherwise it runs the code normally. Notice that this occurs on boot-up only and changing the state of switch in running code will not cause it to switch mode.
Step 1: Replace headers on ESP-01 programmer adapterThe original programmer adapter has short female headers. Theses are heated by a hot air gun and pulled out using a tweezer. The pads are cleaned using paste and solder wick. Afterwards, the long headers are inserted and soldered. Finally, it looks as following photograph shows:
This extended form of the adapter is much more useful. As it solves the problem of powering the circuit as well as flashing and debugging it. But optionally the module can be excluded and power can be provided externally.
Note: The ESP-01s requires 3.3V power
The compounded set of modules is inserted into a breadboard and with jumper wires rest of the circuit as described in Figure 2 is patched as in following photograph: -
The code is in the repo grandeur-thermohygrometer.
Link: https://github.com/sheraz-janjua/grandeur-thermohygrometer
Clone it, download it as zip or copy it into a new sketch.
Step 4: Create account on GrandeurGo to: https://console.grandeur.dev/register/
Fill out the form and verify account.
Name it, describe it, and copy-paste the API-key into Code.
A user profile is used to access a device from canvas or an app.
A device model is used to describe what variables can be communicated by/to the device (temperature and humidity in this case). It is a JSON object as follows:
{"t":0,"h":0}
Multiple devices can be created with the described device model each has a unique device ID and token allotted to it. These credentials are to be copy-pasted into the code.
Pair that device with the user you created earlier so that we can use it to access the device data.
We need the SSID and Password for the Wi-Fi router to which the device shall connect for internet access.
Now, we can upload the code to ESP-01s module.
NOTE: The IO-0 pin must be connected to ground to enable programming mode. The switch SW0 in Fig 3: Wiring diagram must be closed.
The Canvas needs to be authorized using the paired user profile. It is populated by different widgets to display/control variables.
Whenever either the temperature or humidity changes by 0.1 units the dashboard will be updated provided the Wi-Fi is connected and internet access is available.
The code is sufficiently simple to understand as well as commented abundantly. Let's look at the highlights where Grandeur SDK is involved: -
#include <Grandeur.h> // SDK library- The Grandeur SDK library is available on GitHub at https://github.com/grandeurdev/arduino-sdk as well as in Arduino Library manager as shown below: -
Grandeur::Project project;// Grandeur project instance- The project object can be used to reference the devices created and paired in the project.
project = grandeur.init(apiKey, token);- The project API key and the device token identify and grant access to the Grandeur project instance in the clouds.
project.onConnection(onConnection);Here we register a function which is to be called on connection state change. We can monitor cloud connection status in here and take necessary measures when connection is lost.
project.device(deviceID).data().set((param ? "h" : "t"), buff);The device ID identifies which particular device in the project to talk to. This one line of code is the most complex in all the code so let's simplify it: -
project.device(<ID>).data().set(<variable>,<value>); // simplified version of the code
// NOTE: this is not code but only for explanation
The <ID> is device ID allotted on device creation.
The <variable> is the target variable from the device model.
The <value> is the new value of the target variable. In the provided code it is of type char array.
project.loop(_wifi_status == WL_CONNECTED);- This line keeps the SDK running while also letting it know whether or not the Wi-Fi is connected so that it can carry out appropriate actions.
This is all about the use of Grandeur Arduino SDK in this project. The same procedure can be extended for different kinds of sensors. The rest of the code is pretty straight forward and one can make sense of it from the included comments.
ConclusionThe above tutorial concludes that Grandeur proves to be an awesome tool for monitoring sensor data over the internet in the form of a nice customizable graphical dashboard in Grandeur Canvas.


Comments