


Hardware components | ||||||
 |
| × | 1 | |||
 |
| × | 1 | |||
 |
| × | 1 | |||
Software apps and online services | ||||||
| ||||||
Hand tools and fabrication machines | ||||||
| ||||||
Drone-based Air Quality Signage Map is an innovative environmental monitoring solution that uses drone technology to collect, analyze, and communicate real-time air quality data. Equipped with advanced sensors, drones are deployed to survey target areas, using sensors to measure baseline air quality levels. The collected data is processed and mapped to create an updated Air Quality Index (AQI) for each location.
This information is displayed on both digital maps and strategically placed public signage, enabling communities, local authorities, and policymakers to make informed decisions. The system increases public awareness of environmental conditions, supports proactive health measures, and helps identify sources of pollution.
By combining aerial monitoring with visual communication, the project ensures rapid data collection over wide areas while providing accessible, easy-to-understand updates to the public. This approach fosters environmental responsibility, encourages community engagement, and contributes to sustainable urban planning and health protection.
A drone is equipped with a Grove Air Quality (AirQ) sensor to collect air quality data while flying over designated areas. The sensor readings are managed by a Seeed Studio LinkIt ONE development board, which records and transmits the measurements wirelessly.
Collected data is uploaded to a cloud server and displayed on an interactive, web-based air quality map, allowing users to view current conditions from any device with internet access. The system provides a fast and mobile method to measure air quality over wide or inaccessible areas, supporting public awareness and environmental monitoring efforts.
This project measures air quality using a drone carrying a Seeed Air Quality sensor, controlled by a Seeed Studio LinkIt ONE board. The collected information is displayed on a web-based air quality map so anyone can see the results in real time. A web based cloud connnected application is developed for visualizing air quality data on maps.
Data Collection in the Air
The drone flies over the area, and the sensor measures air quality at regular time intervals. Each reading includes:
- Air quality value (pollution level)
- Time of reading
- GPS location (latitude, longitude, and height)
If the drone flies faster, it must take measurements more often to avoid “gaps” in the map.
Example: If the drone flies at 8 meters per second and we want a reading every 10 meters, we must record at least 0.8 readings per second.
Cleaning and Adjusting Data
Before showing results, the system removes incorrect or “spike” values caused by sudden wind changes or sensor errors. It also adjusts readings if temperature or humidity slightly affects the sensor.
In simple terms, the raw number from the sensor is turned into a more accurate number that better reflects real air quality.
In simple terms, the raw number from the sensor is turned into a more accurate number that better reflects real air quality.
Turning Numbers into AQI (Air Quality Index)
Air Quality Index is a scale from 0 (Good) to 500 (Hazardous). Each pollutant range has a color:
- Green = Good
- Orange = Moderate
- Salman = Unhealthy
- Purple = Very Unhealthy
- Red = Hazardous
Mapping the Data
The system fills in the spaces between drone readings so the whole area is covered. This is done using:
- Closest readings weighted more heavily (Inverse Distance Weighting)
- Or smarter methods that predict smooth changes (Kriging)
Both methods make sure nearby points have similar air quality, and areas without measurements are estimated based on nearby readings.
Making the Map
Once the air quality values are ready, they are:
- Converted into map coordinates (so they fit on the web map)
- Given colors according to the AQI scale
- Plotted on the interactive online map for public viewing
In Simple Words
The drone performs the following tasks,
- Measures air quality while flying
- Fixes and cleans the numbers so they’re accurate
- Converts them into AQI colors
- Draws a complete map using both measured and estimated values
- Send it cloud so anyone can check the air quality in real time
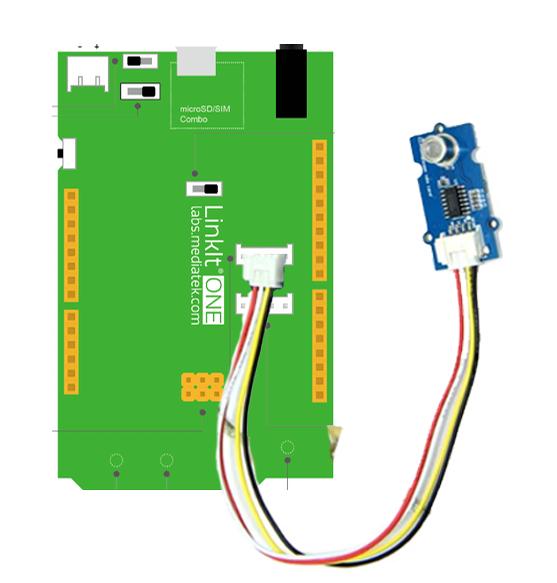
The connection diagram is very simple. Just connect the air quality sensors to the LinkIt One using a Grove connector.
- Real-Time Public Awareness: People can instantly see current air quality conditions without needing to search online or use specialized apps.
- Health Protection: Individuals with asthma, allergies, or other respiratory issues can make informed decisions about outdoor activities.
- Community Engagement: Public signage builds environmental awareness and encourages people to discuss and address local pollution issues.
- Tourist and Event Safety: Outdoor events, schools, and public gatherings can use the information to adjust activities during poor air quality.
- Government Transparency: Displays open and accessible data, showing citizens that environmental monitoring is active and trustworthy.
- Disaster Response Support: In events like wildfires, dust storms, or industrial accidents, signage provides quick and accessible air quality alerts.
- Localized Information: Since drones measure multiple points, the displayed AQI reflects specific local areas, not just general city averages.
- Encourages Sustainable Behavior: Seeing the impact of pollution may motivate people to adopt cleaner practices, such as reducing vehicle use or supporting green initiatives.


Comments