

In today’s world it is important for business to understand the large amount of data. Using spreadsheets is not the best option for business these days.
R is a open source programming language as well as a software environment used for statistical analysis, graphical representation and reporting. It was created by Ross Ihaka and Robert Gentleman. It is considered as a dialect of the S language. It is used widely by scientists across the world. It makes it easy to analyze the data more effectively and efficiently.
R programming language is freely distributed under the GNU General Public Licence. It works in several operating systems like Unix, Linux, Windows and Mac. The files which are needed to install R from the pre-compiled binary versions are distributed from the internet site of the Comprehensive R Archive Network (CRAN).
R programming language has many functions for statistical analysis and graphical representations.
Benefits of using R Programming Language- R is free and is the first major advantage
- You can install R in as many computers as you want
- R is easy to collaborate and learn
- Anyone can write an add on package for R
- Provides the most advanced analysis
- R has the capacity for reproducible research. As a result of this project can be repeated easily when any new data is available
Follow these simple steps to install R on your computer
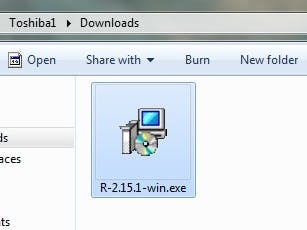
- Download the R from the net and open the R file in the downloads folder.
- Double click the file to open it. This will take you to a security warning window.
- Click Run. This will again take you to a window asking whether you want to allow the following program from an Unknown publisher to make changes to this computer window. Click Yes.
- The next window will allow you to select the language. Select the language and click OK.
- This opens the Setup Wizard window.
- Click Next. After this you will get the GNU General Public Licence. Read it and click Next.
- In the next window select the destination location. The default location is Program Files. Select and Click Next.
- The next window will allow you to select the components to install. Always tick the core files check box and select between 32 bit files or 64 bit files as per your system. Click Next
- The next window will ask if you want to customize the startup options. Select No and click Next.
- The next window will help you to select a Start Menu Folder.
- Click Next. The next window allows you to select Additional tasks and lets you to create a desktop icon or a Quick launch icon. Select both the check boxes of Register entries. Select Next.
- R will get installed. Select Finish button to complete the installation.
After R is successfully installed you can open R using:
- Start Menu to All Programs to R
Or
- You can also double click on the R shortcut icon in the desktop
The R console will pop up as shown in the picture below. RGui is the short form of R Graphical User Interface. It is the most easy way to interact with the R language. You can configure some aspects of the RGui. The RGui configuration Editor dialog box is shown in the picture below
The R Console is the place where you can input commands. Sometimes you will be required to write the command in a script and then run the commands. Script is a separate window where you can type your commands. Below picture shows you how to open a script
To run the commands in the script you can either copy paste the commands into the command window or select the commands you want to run and click the Run line or Selection button.
While typing commands in the Console you can also use previously used commands using Up arrow or Down arrow.
How R worksThe below picture will explain you the work flow of R.
Whenever R is running the variables, functions and others are stored in the memory of the computer in the form of objects with a name. The user can perform various operations on these objects using operators and Functions. An R function can be represented as shown in the picture below
The arguments can be objects which are defined by default or specified by the user. The functions are executed through commands entered by the user. The results are then displayed on the screen and stored as an object in the computer memory.
Basics of R programming languageListed here are the basic concepts that you need to know to work with R.
Commands, Objects and FunctionsWhenever you want to interact with R you can type a command in the console dialog box and press enter. If you have entered any wrong command then you will get an error message. You can make simple calculation easily using R. You can use all the arithmetic operators in the same way as used in the other computer application without the need not type equals sign. Just press enter and you will get the output.
Example:
7+3
[1] 10
3^3
[1] 27
10* (10+2)
[1] 120
(2* (17.2+5))/56
[1] 0.7929
In the above examples you can find [1] in front of all the answers. This denoted that there is only one number in the answer. When there is more than one number in the answer it will help you find out the answer within the groups. And if bracket are added then those calculations are done first. If more than one bracket is added, you can group your brackets using Ad Infinitum.
ObjectsIf you want to perform any further calculations using the output of a calculation then you must give it a name and order R to store it as an object. An example is given below:
answer <- 4+4
In this example <- is called the allocation symbol or the assign symbol. This symbol asks R to make the object on the left into the output of the command on the right. You can also save the results of a calculation made with objects as another object. You can remove an object using rm() function and confirm it using ls() function.
FunctionsR has a large variety of code that will help you to do mathematical calculations, draw graph and do statistical analysis. These codes are called functions. Each function name ends in a pair of brackets and you can also straight away type the name of the function and the name of the object to carry out the operation you need.
Examples:
sqrt (100)
[1] 10
You can also add an object name to perform the calculation.
sin (15+ answer)
The value of the object “answer” is taken here for calculation.
Vectors, Matrices and Data FramesR is the best solution to handle with objects that are group of numbers or group of characters. Groups of number which are organized as sequences are called Vectors. Groups which are organized as two dimensional tables are called Matrices. Tables that contains number in some columns and some other data in other columns are called Data Frames.
VectorsLet’s look at an example to understand what vector is and how it is used in R.
Example:
A <- seq(10,20)
In this example you have created a new object called A and it contains the sequence of numbers from 10 to 20. You can check this by simply typing A and getting the output. It is explained below:
A
[1] 10 11 12 13 14 15 16 17 18 19 20
One of the most important function in Vector is c(). It means ‘concatenate’. An example is given below:
B <- c(2, 4,6,8,10,12,14,16,18,20,22)
B (Press enter)
[1] 2 4 6 8 10 12 14 16 18 20 22
You can also perform arithmetic operations in vector.
A + B
[1] 12 15 18 21 24 27 30 33 36 39 42
When you have data that can be arranged in two dimensions then that is called Matrix. Matrix is denoted by matrix() function. An example is given below for your understanding:
mat2<- matrix(data = seq (1,12), nrows = 3, ncols = 4, dimnames = list (c(“Row 1”, “Row 2”, “Row 3”), c(“Col 1”, “Col 2”, “Col 3”, “Col 4”)
The above example is explained in detail below:
- mat2<- sets up an object called mat2
- matrix (data = seq(1, 12) here object is the matrix and data in the matrix is a sequence of numbers from 1 to 12
- nrows =3, ncols = 4 means that the number of rows is 3 and number of columns is 4
- dimnames = list (c(“Row 1”, “Row 2”, “Row 3”), c(“Col 1”, “Col 2”, “Col 3”, “Col 4”) provides the names for the rows and columns
The output is as follows:
mat1
- - - Col1 -- Col2 -- Col3 -- Col4
Row 1 - 1 --- 4 --- 7 --- 10
Row 2 - 2 --- 5 --- 8 --- 11
Row 3 - 3 --- 6 --- 9 --- 12
Data are always recorded as numbers or quantitative data. Numeric objects can further be divided into real numbers, complex numbers or integers and so on. In case you wanted to find out whether the vector you use is in numeric form then you can use the function mode() and to know the type of numeric you can use the function class().
There is a special type of data in R which is called a Factor. This type of data is where things are divided into classes.
SubscriptsYou can find the individual number or groups within the data structure using subscripts. It will be very much useful.
Example:
X <- rnorm (10, 2, 0.1)
In this example, a vector is created in the name X which is made up of 10 random numbers derived from a normal distribution with mean value being 2 and standard deviation 0.1.
Subscripts do not necessarily have to be single numbers. It can be an object or even an function. Logical expressions can also be included in the subscript.
SubsetsSubset is a function which is used to derive part of a matrix or data frame. It has three main sections – first the name of the subset, second a logical expression, third which informs R about which columns to choose.
Example:
Counts <- read.csv (“Counts.csv”, header = T)
From the below table you can create subset:
Sex --- Temp --- Weight --- Count
M --- Hot --- 75 --- 292
F --- Hot --- 65 --- 180
M --- Cold --- 69.03 --- 161
F --- Cold --- 73.25 --- 323
Counts 2 <- subset (Counts, weight >=70)
This will give you the output of whose weight is less than 70.
R programming language PackagesR installation comes with all the basic set of packages. There are a lot of other packages which will help you to load new functions and objects. You can also create a new package in R. Some of the basic packages included in R during its installation are listed below:
- lattice
- MASS
- nlme
- cluster
- survival
You can use the installed. packages() function to know more about the installed packages.
Statistical MethodsR comes with various statistical methods which are in-built. They are:
- Mean
- Median
- Mode
- Distributions
- Covariance
- Regression
- Non-Linear Mixed effects
- GLM
- GAM and a lot of methods
R also has various statistical procedures like the following:
- Classic parametric tests
- Non-parametric tests
- Linear Modelling
- Non-linear regression modelling
- Smoothing
The bottom line is that R programming language helps researchers as well as business people to perform the effective data analysis. R packages makes it easy for the businesses to do analysis. They do not require computer programmers nor extensive programming to use R. R Programming language helps to create graphics in a more appealing way.
What R you waiting for?
It is the perfect chance to get familiar with R programming language.

Comments