

Hardware components | ||||||
 |
| × | 1 | |||
 |
| × | 1 | |||
What am I creating and why it matters?
We are swamped with data from the moment we wake up to the moment we go to sleep. The amount of data hitting us is increasing each day - new feeds, apps, alerts; all fighting for our attention on our phones and other devices. We are constantly having to interpret this data into actionable insight.
My hypothesis is that an image created through LED lights can be an incredibly powerful, effective and fast communicator of information. I found some research that provided support to this hypothesis. The MIT identified that the human brain can process images in as little as 13 milliseconds. Furthermore, the phenomenon referred to as 'Pictorial Superiority Effect' is based around the theory that pictures and images are more likely to be remembered than words.
In order to evaluate this hypothesis the PixelBrick product was created and used in my home in a real-world setting for a month.
What does it do?
PixelBrick is about gaining insight into those events and services that matter to you through the use of light emitting diodes (LED's), or as I call them here, 'pixels'.
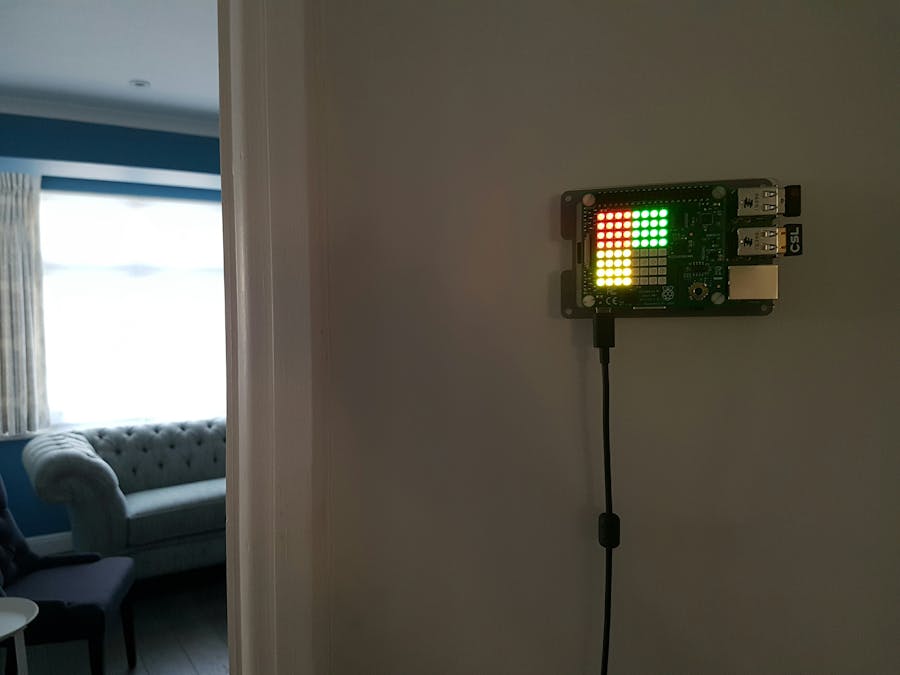
The colour and pattern created through the pixels on a matrix can be used to communicate highly individualised real-time information. The PixelBrick is designed as a smart fixture that would reside in a prominent place in the house where it can be easily observed by the individual and any family members, for example near the front door or by the staircase landing.
Illustrations 1 and 2 above show how the device communicates information to the user. A 8x8 grid of LED's is split into four blocks each 4x4. Each block is allocated to a specific service and is tasked with answering a specific question that the user may have. For example; Is my train on time? Will it rain today? Are any of the doors to my house open?
The device would invoke certain modes during the day, such as the morning, to show specific information relevant to the user at that time. Users could also interact with the device through gesture or voice control.
The device would connect to a hub, such as Wink, through WiFi. The hub would house the server-side software that would connect to various service providers of information such as transport, weather or home security.
Prototyping the PixelBrickScope of the prototype.
For the working prototype I chose to build a service that would answer the typical questions I have in the morning. I chose the morning because most of us are time-starved at this time of the day and it is the moment when we value effective communication of information the most.
This particular prototype would answer four questions that I chose for my convenience and use:
- Is the next train to my work on time?
- Is the train after that on time?
- Will it be noticeably colder or hotter than yesterday?
- Is there a high chance of rain today?
Creating the prototype
After some research on best hardware to use I settled on using Raspberry Pi 2 B board and Sensehat to develop the prototype of PixelBrick.
The Sense HAT board provided the grid of 8x8 multi-coloured LED's that I needed and the Raspberry Pi would run a server side component that would connect to internet based APIs from Wunderground and TransportAPI for weather and transport information respectively. The server was written in Python.
An extensive configuration file contains information of what train and weather stations the server needs to monitor. The file used for the prototype is provided below in the Appendix below.
The core challenge was to develop algorithms that communicated data to me in such a way that meaningful information could be obtained in just a glance through what I defined as the 'dashboard view'. This view would be invoked automatically in the morning during a configurable time period but would not run constantly. I had to respect API call usage limits for the services I was connecting to. After some thinking a few truths were established:
- I did not care about when the next train was. 90% of the time I always take one of two trains to work in the morning. I already know what times they run, but what I do care about is if they are on time. If they are not on time then I care about the magnitude of the delay.
- I do not care if was 13 degrees Celsius yesterday and 15 today, but I do care if it drops down to 5. So really I care about relative difference in temperature rather than absolute between today and yesterday.
- I want to know the probability of rain (precipitation) for today at the moment in time when I look at the device.
These truths allowed me to progress with designing the algorithms that would be used for the dashboard. The return values from the services were decomposed into pixels being lit or not, and in addition, colour was also used to communicate meaning. For example, 'green = on time' and 'red = late', with respect to trains. The illustration below shows how probability of rain is calculated and displayed on the device.
The overall image displayed on the PixelBrick provides me with insight in the morning that will help me make decisions. For example, if there is a high chance of rain I would grab an umbrella before leaving the house. If I know my first train is delayed I would have time for quick coffee before I leave.
More advanced features of the prototype.
As well as the dashboard like view described above I wanted to be able to get actual data returned back through the device. For example, I wanted to be able to set a numerical countdown to the next train that I could see as I was getting ready to leave the house. My wife, who uses the bus instead of train in the morning, was also interested in getting the departure times of the next three busses from a specific stop (This feature was added in easily as TransportApi allows for monitoring of busses as well as trains in the UK). In the production device I would expect hand gestures or voice recognition to be used to access these features but for the prototype we leveraged the 5-way joystick of the Sense HAT to invoke more advanced features (note - the 5th way is to click in).
Video demonstration
Living with the prototype.
We spent a month with living with the prototype, as we engaged with the device each day a wish-list of enhancements started to emerge and a number of them were implemented.
Here are two examples: Firstly, it became apparent that telling me that the next train was 3 minutes away was not so useful when it takes me 10 minutes to get to the station. To manage this a new configuration option was created to account of ‘time to travel’ to both the train station and bus stop. The application then factored these in so it would only show the time to the next 'catch-able' train or bus. Secondly, during the weekend I wanted the application to monitor train times to a different destination station rather than the one closest to my office. A new option was added in the configuration file to allow for this.
I am pleased to say that the PixelBrick has become indispensable part of our lives proving the initial hypothesis correct in our household. Several friends and family members who have seen it in action now also want their own PixelBrick!
APPENDIX
Full configuration file for prototype.


Comments