


Hardware components | ||||||
| × | 1 | ||||
| × | 1 | ||||
 |
| × | 1 | |||
Software apps and online services | ||||||
 |
| |||||
 |
| |||||
Are you ready to take the next steps into a professional embedded design development environment?
This tutorial will give you an overview of the full-featured hardware and software tools that will take your design from concept to production. Follow along with your own hardware, or simply read through, to get a feel for how these robust tools enable effortless embedded design.
This tutorial will cover: START, Studio 7, and Data Visualizer
This tutorial is part of the effortless design workshop series.
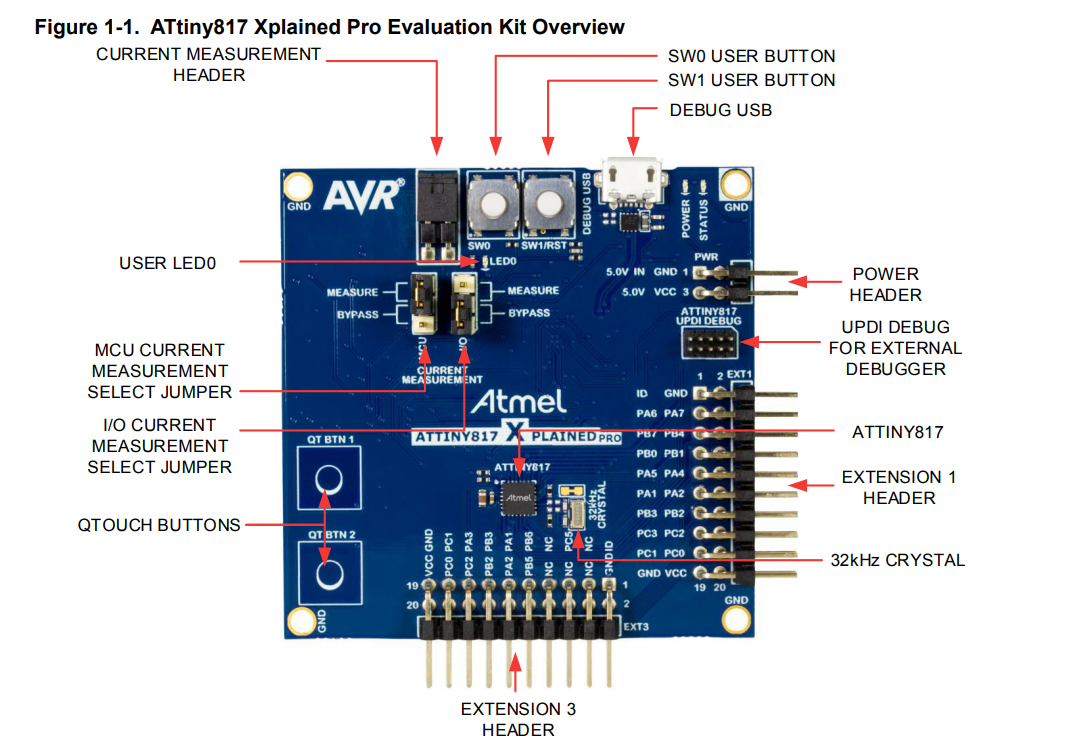
Hardware and Software ToolsThe ATtiny817 XplainedPro
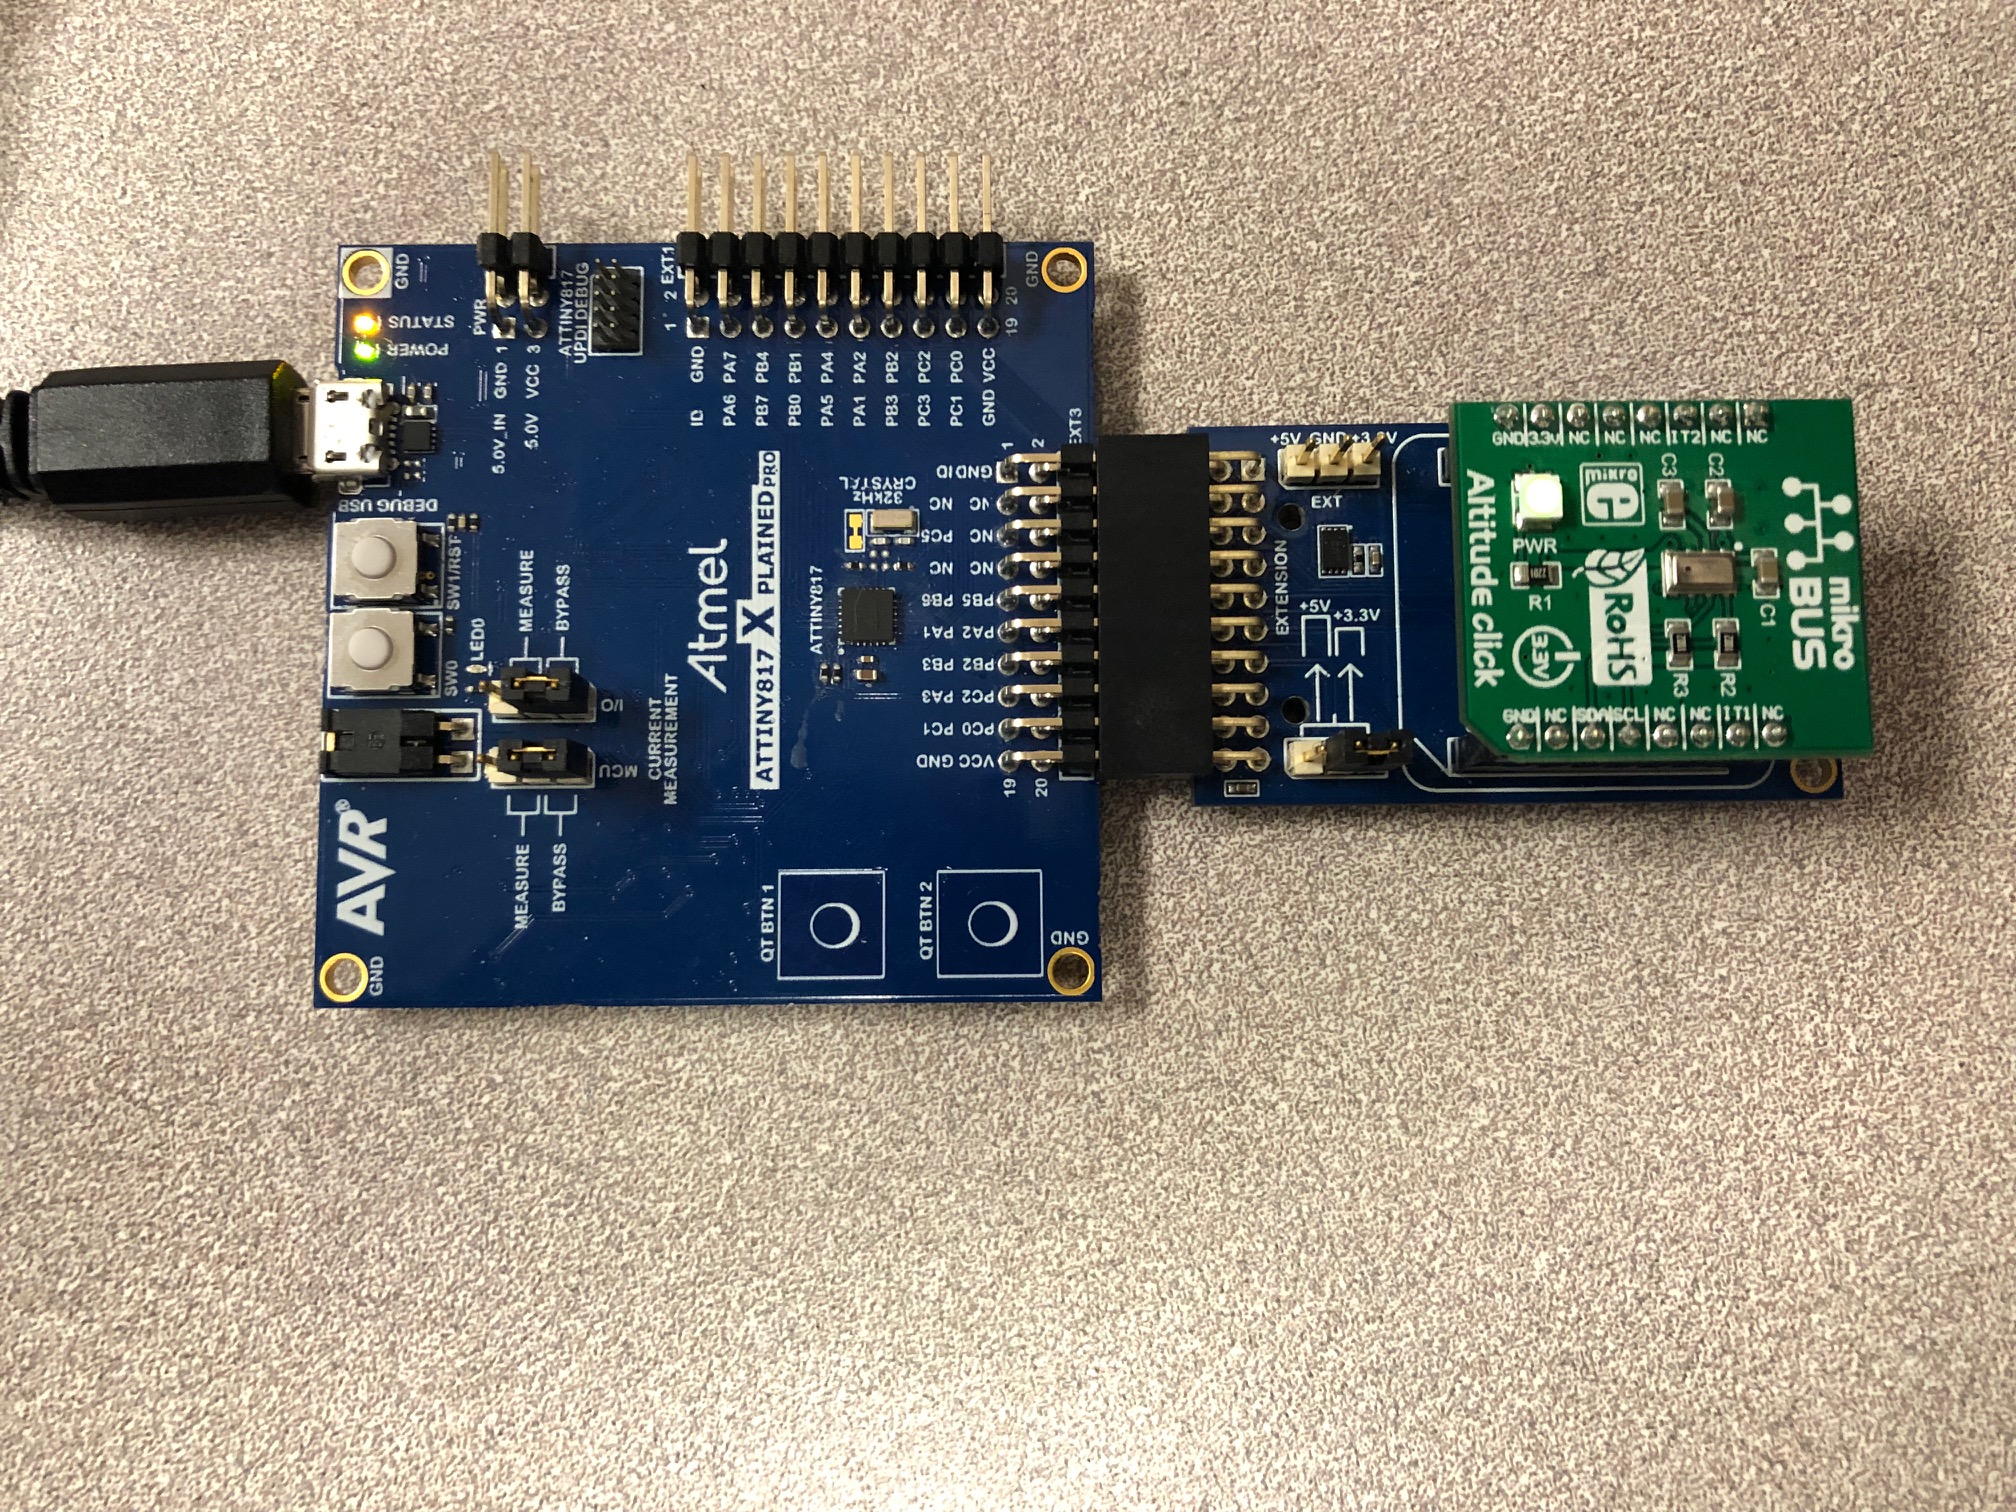
The ATtiny817 Xplained Pro is a great full-featured programmer/debugger development board. It has two interfaces for connecting to extension boards. The extension board used in this demo are the mikroBUS extensions for connecting to MikroElektronika Click Boards.
MikroElektronika Click Boards
This demo will use the MikroElektronika Altitude Click. It is preconfigured with the AVR toolchain to detect altitude and temperature data.
Atmel Studio 7 and Atmel START
Studio 7 is a full-featured IDE for AVR development. Studio 7 is not the only way to program AVR devices. MPLAB-X, originally intended for PIC devices, now includes beta support for AVR devices. Microchip will continue to support Studio 7.
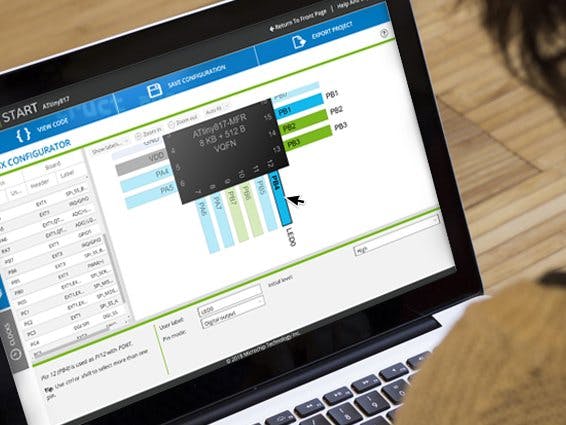
START is an online graphical programming tool for easily configuring MCU design and adding components.
Configure the Altitude Click in STARTConnect your ATtiny817 Xplained Pro and open Studio 7
Studio 7 will detect the development board and display an informational page.
Open START by selecting File > New > Atmel START project
Select your board by typing the information into the search bar
START will automatically generate your board configuration
Click Add software component and search for the Altitude Click
START will generate the configuration for the Click with your particular MCU
Click on the box for ALTITUDE_CLICK_0
Under General, click on User Guide
The User Guide brings up information for configuring the Click, as well as a handy pinout table
Click on Add USART ASYNC to add and configure the USART component. Use the pinout from the user guide to assign the RX and TX pins.
Using the pinout in the User Guide, you can click on the I2C_MASTER box and select the SCL and SDA pins
You should also set the Mode to be Polled because this tutorial does not use interrupts
Click Generate at the bottom of the page and create a name for your project
After you hit OK, START will generate header files for your project
Navigate to the main file and call altitude_example() in the execution loop
When you call a function, a little arrow appears by the text. Click on it and you'll see an option to include the header file for the function you called.
Use this great feature to include the altitude example header file click_example.h.
In the toolbar, click on the hammer icon to select your debugger
Select the nEDBG debugger that Studio automatically detects off your development board
Also in the toolbar, next to the green play button select release
Click on the green play button to make and program the Xplained PRO board
To view data sent over USART serial command, you normally would need to open a separate terminal application like CoolTerm or TeraTerm.
Studio 7 saves you this headache with a useful tool called Data Visualizer
To open Data Visualizer, select Tools > Data Visualizer
Open the Serial Port Control Panel and select the EDBGVirtual COM Port
You can use the CustomDashboard to show off your serial output in useful ways, such as displaying it in a graph, seven segment display and more.
Custom Dashboard works best with data encoded in unsigned bytes int8_t
To get our data into this type, we can take a look at the example code. Right click on the altitude_example() function and click goto implementation. This will take you to the source file.
We can see the altitude_example() function works by calling Altitude_readTemperature(). Right click on this and go to it's header file.
We can see that this function is of type int8_t, so it will show up nicely in the custom dashboard!
Now, let's edit our main file to call this directly. Start typing in USART and select the write function USART_ASYNC_write from the auto-suggestions.
USART_ASYNC_write(Altitude_readTemperature())
Using the same method we used before, include the relevant header files for these added functions.
Make and program the board, and navigate back to Data Visualizer
Click on the Configuration side bar. Select CustomDashboard under modules.
In the dashboard that shows up, check edit and show endpoints. Click on the Elements side bar. Drag and Drop your desired element.
Un-check Edit and then plug the jack icon into the endpoint on the display. This tells Data Visualizer to send data from that COM port to the custom dashboard.
Now you can show off your data! This is a great tool because it allows you to demonstrate your prototype without building an entire front-end app.
The second part of this introduction covers how to easily add connectivity to your design through the MikroElektronika RN4871 Bluetooth 4.2 Click. You'll be surprised at how easy it is!


Comments