

Hardware components | ||||||
 |
| × | 1 | |||
| × | 1 | ||||
Software apps and online services | ||||||
 |
| |||||
Punch Through Design is a company filled with surfers, always keeping track of the surf reports from all the nearby spots. This used to involve pulling up a bunch of tabs in a browser. Now, we just glance at the wall!
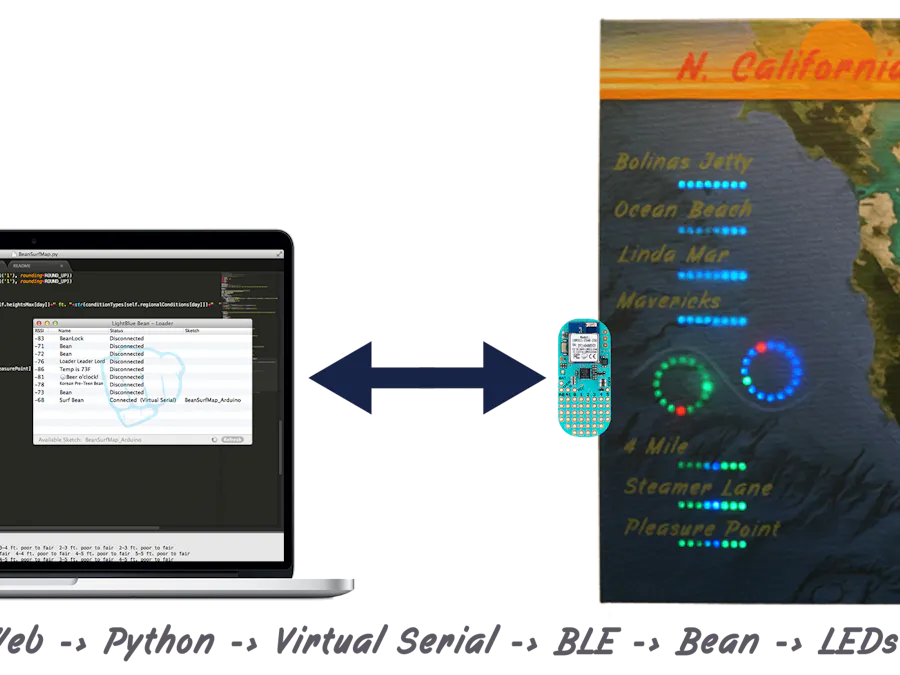
We enjoy seeing technology added to things in a subtle way. With this surf map, when the LEDs are off, you’d never know they are there. This surf map displays the report for the upcoming week, along with tide times, by use of LEDs behind the canvas. The report is pulled from the web by a Python script on my computer, then sent to the artwork over BLE using the Bean’s virtual serial port. Finally the Bean parses the report and displays the LEDs accordingly.
How it worksWhen you start surfing you learn that there are a ton of variables that create ‘good’ surf conditions. Wave size is only one of them. A 5 foot wave from wind-swell with on-shore wind is a lot different than a 5 foot wave from a nice ground swell with off-shore wind. This is why the example reads both the wave heights and the surf quality. Surf quality is a function with many inputs: wind, tide, swell direction and swell size. Luckily for us, Surfline does a lot of this calculation, and they come out with a layman’s rating: Flat, Poor, Fair, Good, and EPIC. If you’re tuned into your local spots, you could pull the raw readings from the off shore buoys and formulate your own ratings.
So our first step is to find a way to get these surf ratings in a format that we can send to our Bean. By using Surfline’s API, we get a JSON object back with all the info we need. Our Python code formats both the surf report and tide times, then sends over a virtual serial port to the Bean. If you’ve used Python with a serial port before, you’re right at home.
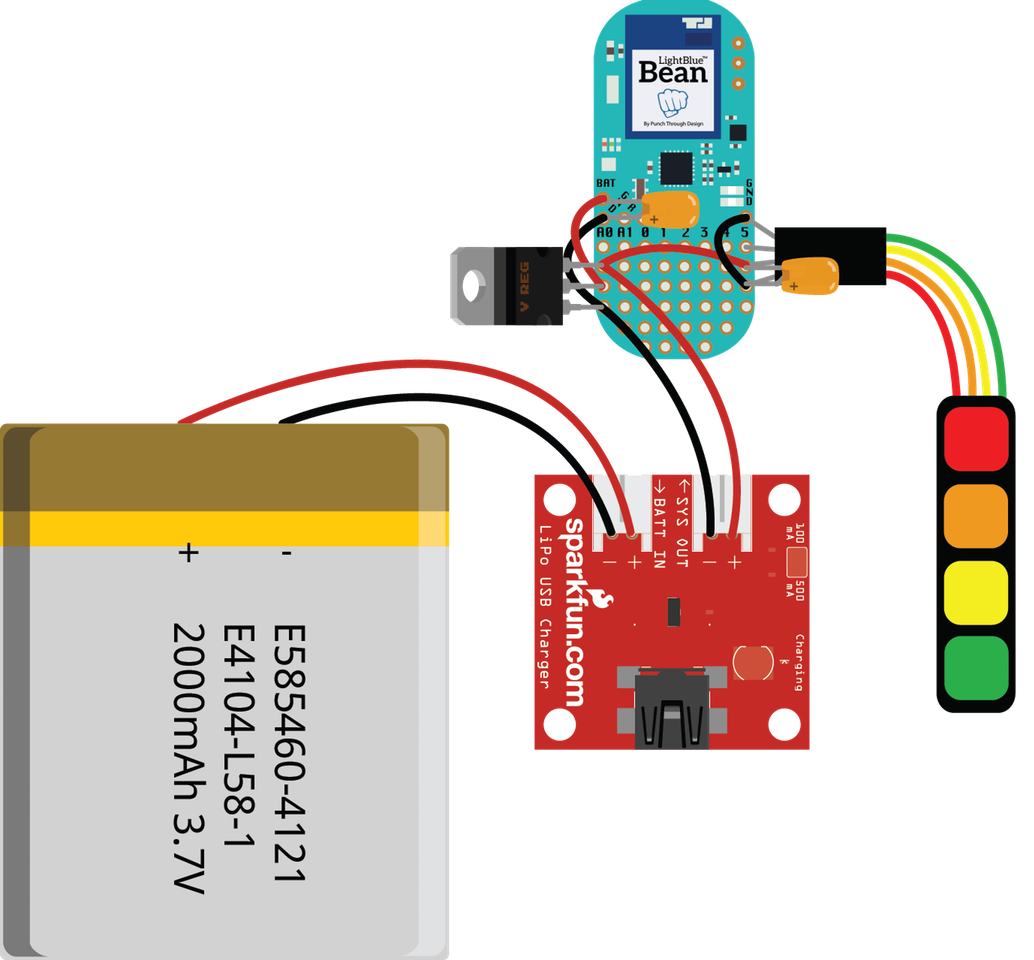
The HardwareBehind the canvas are a handful of NeoPixel LED arrays, a LiPo Battery, and a LiPo Charger. The Bean has an LDO Voltage regulator to keep its voltage at 3V, but the LED Array can run on the full battery voltage.
This is what the final wiring should look like:
The LEDs are placed behind the canvas. The artwork is a print we created, based on actual satellite images of the bay area, with some photoshop filters and 1980s California license plate inspired title.
Find all the code on Github: BeanSurfMap Repository!
Having trouble with this guide? Reach out to BeanTalk to get directed feedback from our developers and community!
Colin Karpfinger 05.28.2014


Comments