

Hardware components | ||||||
 |
| × | 1 | |||
 |
| × | 1 | |||
 |
| × | 1 | |||
 |
| × | 1 | |||
 |
| × | 1 | |||
 |
| × | 4 | |||
|
| × | 3 | |||
Software apps and online services | ||||||
| ||||||
 |
| |||||
 |
| |||||
| ||||||
This project is divided into 2 parts:
- Prediction of sensor values using polynomial regression algorithm
- Self alert system when the values crosses different threshold values and anomaly detection using Z-Score Analysis.
Prediction visualizer has been created in the Bolt Cloud using JavaScript code. Self alert and Anomaly Detection System has been programmed using Python Programming Language.
The system takes taken temperature values as input using the LM - 35 temperature sensor and using polynomial regression algorithm, predicts the temperature values of the future instance. The number of instance for which it can predict can be set in the code but then again we have to tune the model according to the environment and the criteria that we want to achieve.
Parallelly, the input values are checked whether whether it has crossed the values or not. Suppose a case, where we want that temperature should not cross below 20 degree Celsius and should not go above 40 degree Celsius. Also, we want that temperature should not be between 20 and 30 degree Celsius for more than 20 minutes. Also, temperature should not variate suddenly. In that case, if the values goes below and above the threshold values then it triggers an alarm and also sends an alert notification on Telegram. Also, if the temperature gets in between 20 to 30 degree Celsius, it reminds the person to check the prediction graph whether it will remain in the same bound for 20 minutes or not. In every alert case it triggers an alarm for 5 sec and checks the values at an interval of 10 sec.
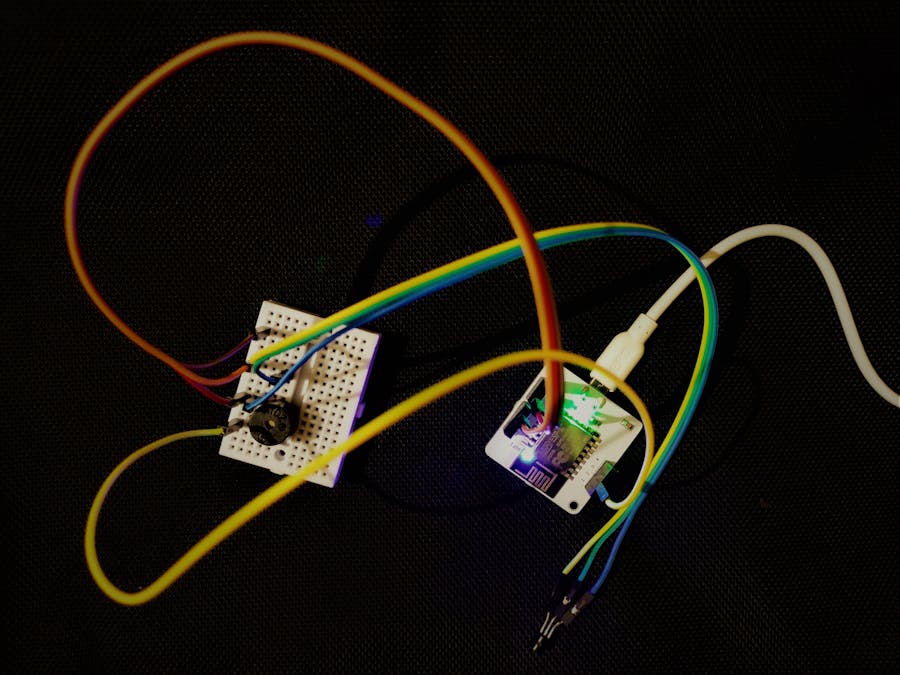
2. PICTORIAL DEMONSTRATION- Circuit
- Prediction Visualizer (example)
- Alert notification on Telegram (example)
This algorithm takes the input and creates a model (a polynomial function) which tries to minimize the cost function ( i.e. difference in the actual value and that obtained from the polynomial function) i.e. in short, tries to fit the value as much as possible. Thus, once it creates a function it then predicts for a future instance. It alters its model each time the input is entered.
Prediction points: This number tells the Visualizer how many future data points need to be predicted. By default, the Visualizer spaces the points with the data collection time in the hardware configuration of the product. So if you set the product to collect data every 5 minutes, and select 6 prediction points, the Visualizer will predict the trend and show 6 points up to 30 minutes into the future.
No. Polynomial coefficients: Polynomial Visualizer processes the given input time-dependent data, and outputs the coefficients of the function of the form:
which most closely resembles the trend in the input data. This number tells the Visualizer how many elements should be present in the function i.e. the value of n.
Frame Size: These are the number of previous data points the Visualizer will use to predict the trend of the data. For example, if you set this value to 5, the Visualizer will use the previous 5 points to predict the trend.
4. DETECTION OF SUDDEN CHANGE IN TEMPERATURE(Z-SCORE ANALYSIS)Z-score analysis is used for anomaly detection. Anomaly here means a variable's value (light intensity of the surroundings) going beyond a certain range of values. The range of values is called bounds (upper bound and lower bound). These bounds are calculated using the input values, frame size and multiplication factor. The frame size is the minimum number of input values needed for Z-score analysis and the multiplication factor determines the closeness of the bounds to the input values curve.
Given above is the formula to calculate the bounds. Here the input is represented as 'Vi', 'r' denotes the frame size and 'C' is the multiplication factor. Firstly we calculate the mean (Mn) of the input values (for every new input, the mean is calculated again). The variation of each input value (from the mean) is given as (Vi - Mn)^2. The Z-score (Zn) is calculated as shown above ( square root of the mean of the variation of each input value multiplied by the multiplication factor). The bounds are represented as 'Tn' and the upper bound is calculated as (Vi + Zn) and the lower bound is calculated as (Vi - Zn).
The frame size and multiplication factor are determined using trial-and-error method.
5. SETTING UP PRODUCT ON BOLT CLOUD AND CREATING THE PREDICTION VISUALIZER:Go to https://cloud.boltiot.com/ and follow the given steps:
The python coding for this project has been done in Ubuntu (Linux). Before we start coding of the automating controlling of LED brightness in python, we need to make a configuration file which will have the specific keys for each user/device. We will import this file in our main code and use the various attributes. The advantage of this is that each user will only have to change the contents the configuration file to use the product.
The API key and Device ID of the Bolt module can be obtained from:
Install the Telegram App and sign in using your mobile number. Then follow the following steps to create a telegram channel and bot.
Create a new channel and give a suitable name and description and set the channel as Public and give a permanent link name.
When temperature increases, voltage across the LM-35 sensor pin increases and vice - versa. The actual temperature is obtained by multiplying the sensor data by 0.097, i.e. Actual Temperature = 0.097* Sensor Value
_qp21OmP1gW.jpg)
_wze1LuStfz.jpg)


_qp21OmP1gW.jpg)
_wze1LuStfz.jpg)
Comments