

Hardware components | ||||||
| × | 1 | ||||
Software apps and online services | ||||||
| ||||||
This article is a supplement to my Conference Room Truth Serum project. In that project, I used a motion sensor attached to a Raspberry Pi 2 running Windows 10 IoT Core to determine whether or not a conference room was empty and to send the status of the room to Azure IoT Hub. Now, I want to view that data in different ways.
To view the data, I am using Microsoft's Power BI desktop - it is free and I don't have an enterprise license to the use the cloud-based version. But, the desktop version still brings a lot to the table with respect to data analytics and visualization so it seemed like a good tool to learn. And, I am still very much in learning mode with Power BI - I have just scratched the surface.
The basic process is to use Azure Stream Analytics to get your data from Azure IoT Hub to a place (or places) where you want to store it and/or analyze it. In this instance, I defined an Azure Stream Analytics job to take the data from Azure IoT Hub and put it in Azure Storage. I moved the data over from IoT Hub to Table Storage as is but you can do some transformations or groupings in the Stream Analytics query if needed. Once the data was in Table Storage, I connected to it from Power BI. Then I was able to use Power BI's tools to view the data.
Before creating your Azure Stream Analytics job to output your data to Table Storage, create your storage account first. Log into the Azure Portal, click New, click Data + Storage, click Storage Account, and finally click the Create button (Resource Manager should be the default deployment model).
Now, a new blade will open where you can define your Storage Account:
- The Name for the Storage Account must be unique within Azure. There will be a red exclamation mark if the name already exists. I named my storage account "peejster".
- Select the account Type. Standard-RAGRS is the base type and is the least expensive since there is no geo-redundancy.
- Select your subscription. My Free Trial expired a couple of months ago so I had to switch to a Pay-As-You-Go subscription. Up until now, since I was using the free tier of Azure IoT Hub, I incurred no costs. I assume that the Storage Account will generate some nominal fees.
- Create a new Resource group or select an existing one. Now that I am adding more services, I created a new resource group - "ConfRoom" - and used it to group together my Storage Account and my Stream Analytics job. I should go back and add my IoT Hub to the same group.
- Selection the location for the Storage Account. Ideally, you will put your IoT Hub, your Stream Analytics, and your Storage Account all within the same location / data center. Technically, they don't have to be (if you look closely, you'll see that my IoT Hub is in the East US while my Stream Analytics and Storage Account are in the West US. This wasn't done on purpose; I just didn't pay enough attention when I created my services. For this project, any minor delays due to moving data from one location to another is inconsequential, but, I think that I may incur some unnecessary data transfer charges as a result. (Later, I'll try to figure out if I can move my IoT Hub to the West US location as well.) The bigger issue with having the storage account in a separate region from the IoT Hub is that I can't use this same storage account for monitoring and diagnostics of my IoT Hub - a second storage account located in the same region as the IoT Hiub will be required if I were to turn on monitoring for the IoT Hub.
Once you have entered all the necessary info, click the Create button.
After the Storage Account has been created, open it (click on the Storage Account tile on your dashboard). Then click the key icon (just above and to the right of all the "Essentials"). In the "Access keys" blade, copy to the clipboard the primary Access Key (lablled "KEY1"); this key will be needed when defining the output of your Azure Stream Analytics job. At this point, you don't actually need to create a table within your Azure Storage Account for the output of the Stream Analytics job - once you define the output for Stream Analytics, a table will automatically be created for you.
Create your Stream Analytics job: click New, click Internet of Things, and click Stream Analytics job. Then define your job in the "New Stream Analytics job" blade:
- enter the job Name - I named the job conf-data-processing.
- select your Subscription.
- select a Resource Group - I am adding this job to the ConfRoom resource group.
- select a Location - I am putting the Stream Analytics job in the same location as my Storage Account (West US).
Click Create. Once the Stream Analytics job has been created, click on the tile on your Dashboard. You'll see in the screenshots that I already have one Input and Output defined; those of course won't be there when you first create your Stream Analytics job.
First, you'll need to define an input to the Stream Analytics job. Click on the "Inputs" box in the "Job Topology" section. Then in the "Inputs" blade, click the plus icon to add a new input and enter the following:
- enter the name for the input (you'll use this name when you create your query for the job).
- leave Source Type as Data stream.
- Select IoT Hub as the Source.
- enter "service" as the Shared access policy name.
- paste in the access key for the IoT Hub (open another window, log in to the portal, open the IoT Hub, click on the key icon above "Essentials", and copy the access key).
- enter a consumer group. If you didn't create one when you created your IoT Hub, I would go back and do it (open another window, log in to the portal, open the IoT Hub, click on the settings icons, click on Messaging, scroll to the bottom of the blade, and add a consumer group below "$Default"). I found that the default consumer group didn't work for me and that I needed to explicitly define one.
- leave Event serialization format as JSON.
- leave encoding at UTF-8.
Click Create.
Next, define an output. Click on the "Outputs" box in the "Job Topology" section. Then in the "Outputs" blade, click the plus icon to add a new output and enter the following:
- enter the name for the output (you'll use this name when you create your query for the job).
- select Table Storage for Sink.
- enter the name of your Storage account.
- enter the storage account key (you may have to go back and copy it again).
- enter a Table name (it will be created for you once you create the output).
- enter the field name from the data set you are sending to IoT Hub which you want to use as the Partition key - I am using the deviceId so that the Table partitions together all the data from that device.
- enter the field name from the data set you are sending to IoT Hub which you want to use as the Row key - I am using time as I know that value will be unique for a given device. One important thing to note is that there are some limitations on what characters you can use in your Partition key and Row key. For example, forward slashes and backward slashes aren't allowed. I had forward slashes to separate the date elements in my time field so my output to the table was failing. Once I changed the format of the time stamp that the device was sending, everything worked as expected.
- I left batch size at 1 since I am only sending data from the device to IoT Hub once per minute.
Click Create.
Finally, define the query. As I mentioned earlier, you can do some computations or transformations within the query itself. But, I simply want the data as is - the "deviceId", the "time", and the "roomstatus". And I take that data from the input I defined to the output I defined. That's it.
Click Save. Now, start the Stream Analytics job.
In the main blade for your Stream Analytics job, below the "Essentials" and Job Topology" sections, there is a "Monitoring" section. Click on it and turn on diagnostics - you can use the same Storage Account you created for the table output. After you turn on diagnostics and let the job run for a few minutes, your monitoring chart should look like mine - an equal number of inputs and outputs.
If you aren't getting any inputs, then double check that your device is sending messages to IoT Hub (I use Device Explorer to view messages in IoT Hub). If messages are going to IoT Hub but you still have no inputs in your Stream Analytics job, then double check that you defined your input correctly - the IoT Hub and access key are correct and that you have selected a valid consumer group for your IoT Hub. If you have inputs but know outputs, double check that you defined your output correctly - Storage account and access key are correct, that the partition key and row key you specified actually exist in the data set your device is sending to IoT Hub, and that you have no unsupported characters in the values of your partition key and row key.
While you can get performance stats from the Azure Storage Account blade, I haven't found a way to view the data via the portal. There are different tools available to browse the contents of your Azure Storage Account including the Azure SDK for .Net (VS 2015) which adds a Cloud Explorer to Visual Studio. There is a stand alone desktop app called Azure Storage Explorer but it currently only supports blog storage (the website states Table Storage coming soon).
Now, download and install Power BI Desktop. Launch the application. First, connect to the table in Azure into which you output the data - click on "Get Data", select Azure Table Storage, and use the Navigator to select the correct table.
After connecting to Azure (entering my Storage Account name and access key) and selecting the appropriate table, you will need to do a small transformation on the data in order to break out the room status into it's own column. Once you have chosen the appropriate table from your Storage Account, click "Edit" rather than "Load" - this will launch the Query Editor.
In Query Editor, select the "Content" column and then select "Expand" from the "Structured Column" option in the "Transform" menu. Select the "roomstatus" column only - the deviceId and time are already represented in the table via the Partition Key and Row Key columns respectively - and then click "OK". (Looks like the time stamp from the Stream Analytics job and the time from the device aren't in sync. I need to set the locale in Azure to the same time zone as the device.) Finally, click "Close & Apply" from the "Home" menu.
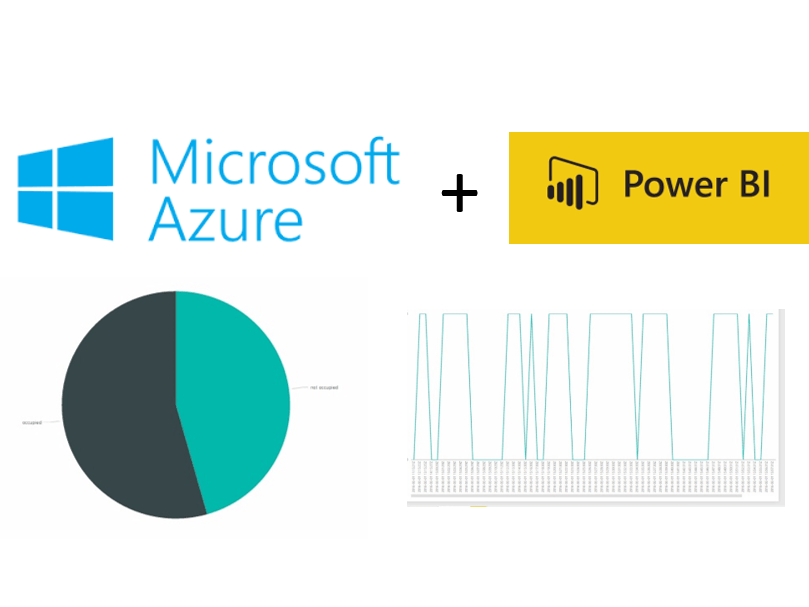
Now that we have the data, let's do some visualization. As I mentioned in the beginning, I am still learning Power BI - this is my first time using the tool - but, I was still able to create some reports that clearly tell the story of the usage of the Baker conference room. For example, this report shows the percentage of time between 3 and 4pm that the room is occupied.
To create the report, I selected Pie Chart. Then I selected "roomstatus" as the Legend. And when I dragged "roomstatus" to Value, Power BI automatically changed the Value to "Count of roomstatus". Finally, I added an advanced filter using the Row Key - I am including only the data which has a time which contains " 15:" - i.e. between 3 and 4pm. Then, I added a second page to the report. For this page, I selected a Line Chart. I used the Row Key as the axis. I created a new column for the values and assign the column the formula: Column = if (conferenceRoomTable[Content.roomstatus] = "occupied", 1, 0). (To create a new column, click on your table name in the "Fields" blade; then the Data Tools / Modeling menu will appear with a "New Column" option.) Looks like my sensor missed a few readings - I doubt everyone ran out of the conference room for one minute and then came back in. I may have to write a formula to bridge those small gaps.


Comments