
Hardware components | ||||||
 |
| × | 1 | |||
| × | 1 | ||||
Software apps and online services | ||||||
 |
| |||||
Real-time graphics plotting is possible in PLC but they are expensive equipment. One of the advantages of Raspberry Pi is that you can easily draw these kinds of graphics as it runs on a performance operating system. Only the supply voltage recording is vital for some situations.
The Raspberry Pi shield MiniIOEx-3G, you can easily record analog input voltages as 4-20mA or 0-30V and thanks to Raspbian, you can even access these graphs via e-mail on a daily / weekly / monthly..
We can create GUI with Python Tkinter library. The Matplotlib library also shows the graphics we have drawn in this GUI. The following libraries must be installed
- Matplotlib
- PIL
We can download libraries using the following commands via terminal:
$sudo pip3 install –U matplotlib
$sudo apt-get install python3-pil.imagetk
We will use the icon as a button in the GUI design. The use of icon makes the GUI turn into a more professional job. You can download icons on flaticon.com from the desired pixels.
Thanks to the PIL library you can do animations in the GUI. For example, you can design the filling of a water tank in the GUI. Then an additional document will be prepared on this subject.
The following equipment is required to perform the operations in this document:
- 1pcs Raspberry Pi 3 B +
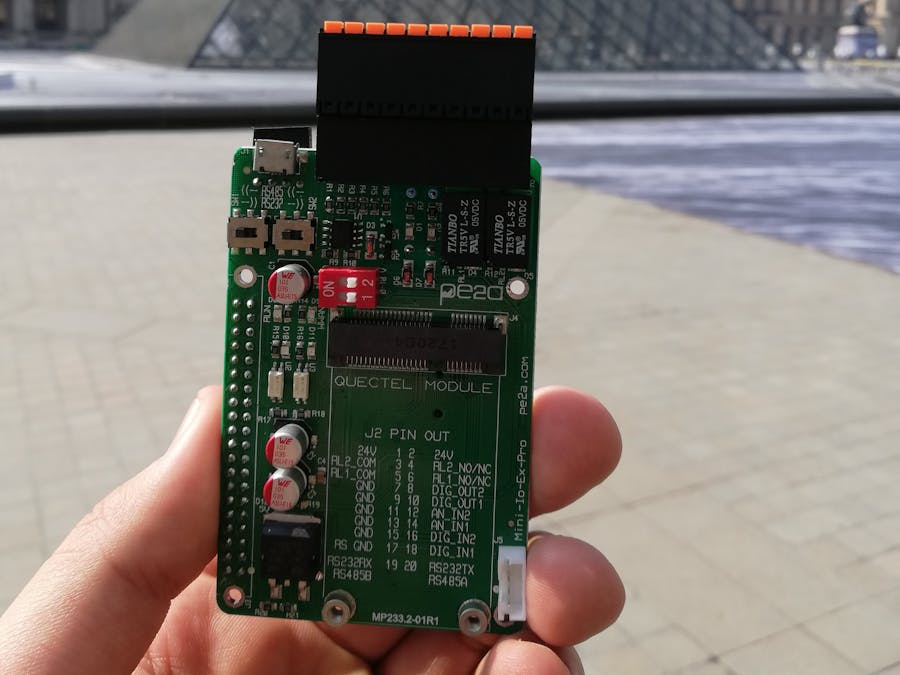
- 1pcs MiniIOEx-3G
- 1pcs 5V USB Power Adapter
One of the advantages of the MiniIOEx-3G is the Analog Input integrated on the 5V and 24V supply voltage allows the measurement without requiring any extra equipment.
Note: You can find that important information about basic SPI functions in previous documents.
CommissioningAfter installing the devices, we can start reading data. We have 2 pages in the project.
- Charts
- Help
Graphical drawing operations are performed only on +Charts page. If this project was a real project, it could be included in other pages. We use the following libraries for analog reading of Raspberry Pi:
#Raspberry Pi IO library
import RPi.GPIO as GPIO
import spidev
The following libraries is called for graphics and basic functions:
import tkinter as tk
import time
from tkinter import *
from PIL import ImageTk, Imagefrom matplotlib.backends.backend_tkagg
import (    FigureCanvasTkAgg, NavigationToolbar2Tk)# Implement the default Matplotlib key bindings.
from matplotlib.backend_bases import key_press_handler
from matplotlib.figure import Figure
We have two pages. These are the Charts and the Help page. Tk.Frame is the main class structure. Page is the main class of Charts and Help. So we can create as many pages as we want.
When you run the code on the terminal, you can check that the graph is moving:
$python3 PowerSupply_5V_RealTime.py
You can access the full code: https://github.com/pe2a/miniIOEx3G/tree/master/examples/RealTimeGraphics/PowerSupply_5V


Comments