
Hardware components | ||||||
 |
| × | 1 | |||
| × | 1 | ||||
| × | 1 | ||||
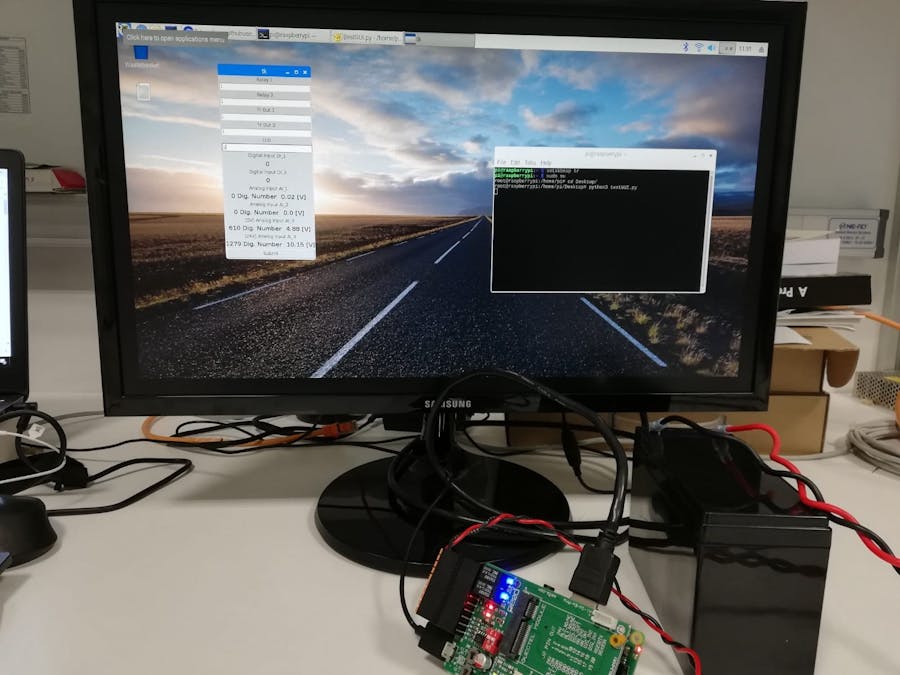
Raspberry Pi can also be used in places without electricity. For example, water pumping stations or in areas such as animal monitoring, and so Raspberry Pi work with battery. If the values/data/image etc. are critical; it must be monitored continuously, it is important to keep the system alive. The way to do this is to monitor the battery voltage. If you can monitor the battery voltage, when the battery will run out, you can replace the battery with a spare battery. With the industrial Raspberry Shield named MiniIOEx, you can easily monitor the battery and Raspberry Pi supply voltage. An external cable connection is not required. The 12Bit Analog Input sensor on the MiniIOEx is also connected to the 24V and 5V line. The power block on the MiniIOEx converts the voltage from 5V to 30V to 5V. Therefore, you can also supply the MiniIOEx with 12V battery voltage instead of 24V.
Physical Interface- 12V 7Ah Rechargeable Battery
- Industrial MiniIOEx
- Raspberry Pi 3 B+
- 16GB SD Card Class 10
- matplotlib
You can easily install matplotlib by using at below command:
$:pip install –U matplotlib
In addition, SPI must be enabled because we will use the python with the SPI-based comm. You can review the comments in the attached link. [Https://github.com/pe2a/miniıoex3g/blob/master/readme.md#analog-input]
You can install the battery terminal to MiniIOEx terminal as shown at below:
The Matplotlib library is a program that draws highly useful graphics on Raspberry Pi and is very easy to use. Since we have installed the related library and made SPI settings, we need to run the following code: https://github.com/pe2a/miniIOEx3G/blob/master/batteryVoltage.py
After the run code, we can get 1min or 10min graphics of battery voltage. Raspberry Pi has Operating System and this system works unbalanced as considering current demand. So, you can see that unbalanced load in figures.

Comments