


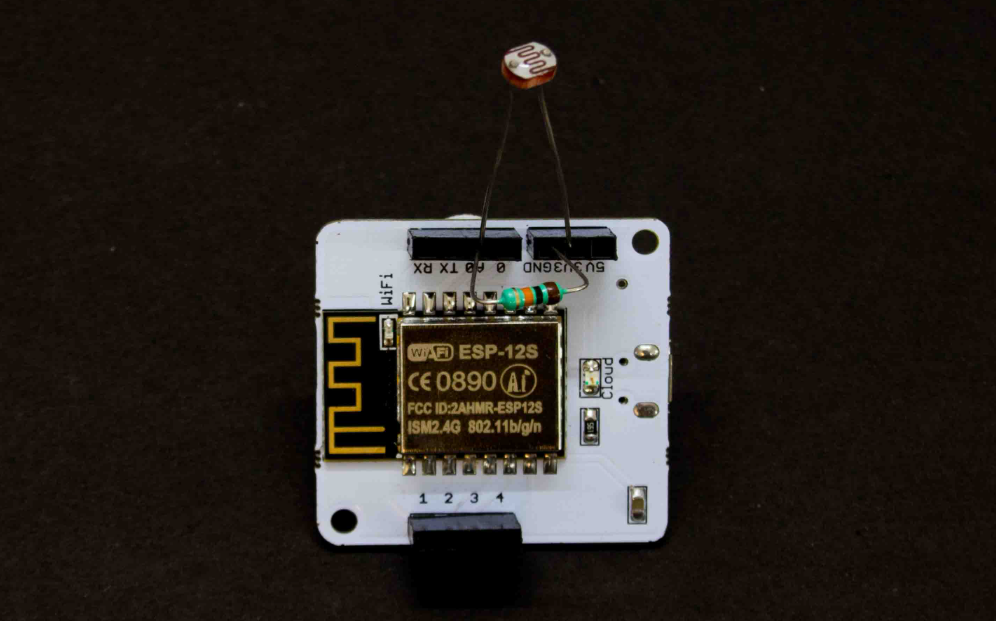
Hardware components | ||||||
 |
| × | 1 | |||
 |
| × | 1 | |||
 |
| × | 1 | |||
Software apps and online services | ||||||
 |
| |||||
| ||||||
🌟 Light Intensity Monitoring System using Bolt IoT
🔹 IntroductionThis project demonstrates a Light Intensity Monitoring System built using a Bolt IoT Wi-Fi module and an LDR sensor.The system measures light intensity in real-time, uploads it to the Bolt Cloud, and visualizes the data using the Google Chart library.Different graph types such as Line, Bar, Scatter, Area, and Gauge are used for analysis.
🔹 Hardware SetupThe LDR sensor is connected to the Bolt Wi-Fi module. The one leg of sensor connected to 3v3 pin and other is to A0 pin. Similarly 10k Ohm Resistor one leg is connected to A0 and another to GND pin. The sensor output changes with light intensity, and these values are sent to the cloud for storage and visualization.
🔹 Cloud SetupThe Bolt Cloud is linked with the device to collect sensor readings continuously. This data can then be used to generate multiple graph formats.
🔹CodeplotChart()→ Function provided by the Bolt Cloud to draw charts.'time_stamp'→ The x-axis data (time when the reading was taken).'light'→ The y-axis data (sensor values from the LDR).
👉 Together, it tells the chart: “Plot light intensity values (y-axis) against the time of measurement (x-axis).”
plotChart('time_stamp','light');Explanation:Sensor values are stored with timestamps. This raw data forms the base for plotting graphs and analyzing patterns.
🔹 Graph Visualizations1. Line GraphsetChartLibrary('google-chart');
setChartType('lineGraph');
plotChart('time_stamp','light');Explanation:The line graph shows how light intensity changes over time, making it easy to track trends and variations.
2. Bar GraphsetChartLibrary('google-chart');
setChartType('barGraph');
plotChart('time_stamp','light');Explanation:The bar graph displays readings as vertical bars, allowing quick comparison of light intensity at different times.
3. Scatter GraphsetChartLibrary('google-chart');
setChartType('scatterGraph');
plotChart('time_stamp','light');Explanation:The scatter graph plots each sensor reading as a point, showing data spread and outliers clearly.
4. Customized Area GraphsetChartLibrary('google-chart');
setChartTitle('Light Intensity Monitor');
setChartType('areaGraph');
setAxisName('Time','Light');
setCrossHair(true);
plotChart('time_stamp','light');Explanation:The area graph highlights intensity variations with shaded regions.Customizations such as chart title, axis labels, and crosshair make it more informative.
5. Gauge GraphsetChart Library("google-chart");
setChartTitle('Gauge Chart');
setChartType('gauge');
setAxisName('light_data');
setDimensions(400, 400);
setMaxValue (1023);
plotChart('light');
setGreen (250, 500 500)
setYellow(501, 715);
setRed (725, 1023);Explanation:The gauge graph represents real-time light intensity like a dial. It instantly shows if intensity is low, medium, or high.
🔹 Final OutcomeThe system successfully monitored and visualized light intensity in multiple graph formats.It provides a clear understanding of environmental light variations and enables easy data-driven analysis.
🔹 My Learnings- ⚡ Interfacing sensors with the Bolt IoT Wi-Fi module
- ☁️ Sending and storing data on the Bolt Cloud
- 📊 Using Google Chart library for multiple graph visualizations
- 🛠️ Customizing chart titles, labels, and crosshair
- 🌍 Publishing and documenting projects on GitHub and Hackster
- 💡 Understanding real-time IoT applications for monitoring systems


Comments