


Hardware components | ||||||
 |
| × | 3 | |||
 |
| × | 2 | |||
 |
| × | 3 | |||
| × | 1 | ||||
Software apps and online services | ||||||
| ||||||
 |
| |||||
| ||||||
The challenge covered on this project says as follows:
As an office manager, I am concerned about the health of my employees. I would like to know if the air quality in the office space and meeting room is OK. Can you convince me that IoT can help me in getting insights about the health of the air in the office?
General introductionAs it's the typical case for an IoT project, this document will cover the next main sections:
- Data Acquisition (DA)
- Data Collection and Treatment (DC)
- Data Visualisation (DV)
These 3 main steps will be followed during the explanation of the project.
Selection of Protocols and corresponding preparation.Considering the tight timing available for the execution of the project, the definition of the architecture was strongly influenced by the components already available. Knowing the small amount of data to be transmitted and also considering the special interest of the Project Team about LoRa and LoraWAN, this was finally the option selected.
The Things Network (TTN) was selected for this project. At TTN they have a special community based approach where the access to the network is provided and shared by the users.
Basics about The Things Network(TTN):
To start, an account should be created. For all what is The Network Thing projects, the Project Team prefers to work with its own TTN gateway (instead of relying on the TTN gateway of somebody else), so it needs to be properly configured and added to TTN.
The TTN profile of the Project Team can be found here: https://www.thethingsnetwork.org/u/omarecd
Going to the Gateways section, on the TTN console, it can be seen that the Gateway is located in the Brussels region and it is currently active:
Checking the gateway overview all the current settings can be found. The corresponding frequency for Europe (868MHz) is there.
After making sure that a TTN gateway will be always available, the next step is the corresponding creation of the TTN the application, completing the corresponding values:
To have:
On the 3rd tab, the payload format used by the devices is configured. Here the Cayenne Low Power Payload is selected.
The Cayenne Low Power Payload (LPP) provides a convenient and easy way to send data over LPWAN networks such as LoRaWAN. The Cayenne LPP is compliant with the payload size restriction, which can be lowered down to 11 bytes, and allows the device to send multiple sensor data at one time.
https://developers.mydevices.com/cayenne/docs/lora/#lora-cayenne-low-power-payload
On the integrations tab, MyDevices was selected, which will be the application used for the project.
Finally, on the settings part, some extra parameters can be found.
With the TTN Application created, the corresponding devices should be created on it. The Project Team likes to perform different tests while advancing on the project so even if the final scope will cover 2 devices a 3rd one is also configured and ready to be used mainly for testing purposes.
Checking in more detail the device 1:
Something to keep in mind with LoRa is the small bandwidth available, that is the reason why the usage of a coding becomes convenient.
DA: First question: What is going to be measured and how?Taking as starting point the influence of the environmental office conditions and their impact, the initial elements to be measured were Temperature and Humidity. With the purpose of having a more complete insight, the Air Quality was also considered.
To measure Temperature and Humidity it was selected the DHT11 as it was a sensor already known by the Project Team, providing quite reliable results, it is for sure very good value for money.
Now, regarding the Air Quality the decision was a little bit less simple as this topic was completely unknown by the Project Team. Due to the very tight time constraints for the project the research needed to be done very fast. At the end, the "Air Quality Sensor v1.3" from Seed Studio was selected. Fortunately, the sensor was available on a local shop in Belgium and they managed to deliver the components Very rapidly. According to the producer:
Grove - Air quality sensor v1.3 is designed for indoor air quality testing. It can respond to carbon monoxide, alcohol, acetone, thinner, formaldehyde, and other slightly toxic gases.
The sensor has a MP503 inside, more details are indicated below:
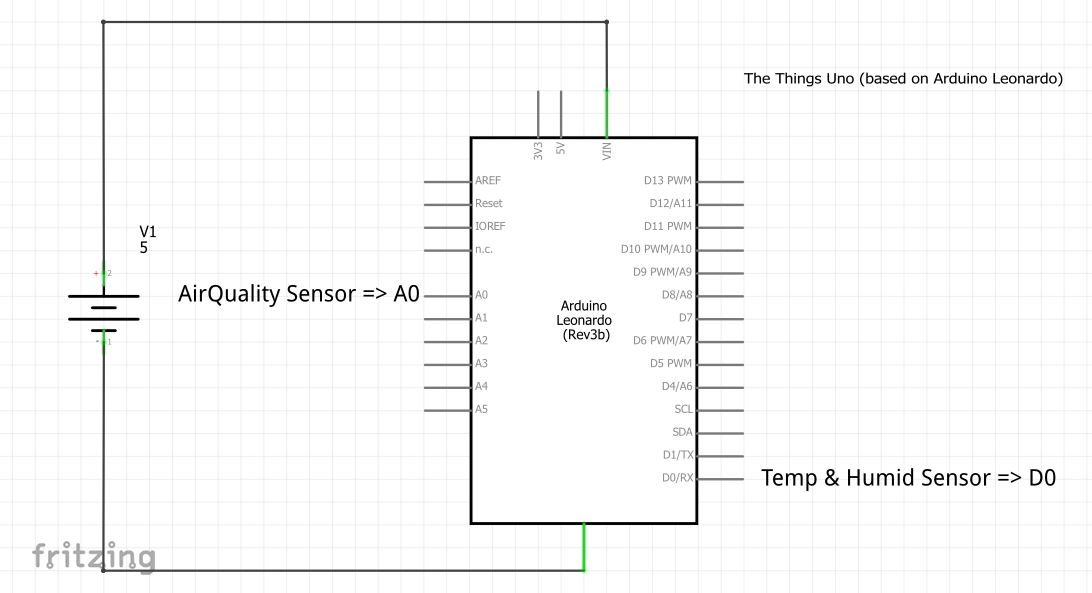
To receive the data from the sensors, it was used an Arduino. Then, the selection of the exact model depended in fact of the Data Collection and Treatment (LoRa/LoraWAN). It was selected then a The Things Uno, which is basically an Arduino Leonardo with extra LoRa capabilities.
DHT11
Provides the information as a digital output (signal goes to a digital pin).
Having an digital input makes that some treatment is necessary to understand the data. Fortunately all this is taken care by the corresponding library.
Air Quality Sensor v1.3
Provides the information as an analog output (signal goes to an analog pin).
Having an analog input in a way facilitates the things a bit, due to the fact that the input signal will always be there. A value between 0 and 5 volts will be read by the microcontroller, then it should be interpreted accordingly.
It was the first time that this type of sensor was used by the Project Team, that was the reason why some basic testing was needed initially, as it can be seen below.
DA: Coding the information on the MicroController before it's sent to the LoRa Gateway.LoRa offers a long range coverage however the data to be sent needs to be minimal. As indicated previously, for the case of this project the payload will be formatted as Cayenne LPP, which allows the device to send multiple sensor data at one time, while being compliant with LoRaWAN restrictions. For the case of this project: Temperature, Humidity and Air Quality indicator will be sent.
Unfortunately Cayenne Low Power Payload doesn't include an exact data type for Air Quality measures. However this is not a big problem, another data type is considered temporarily (Illuminance). Then at the moment of displaying the information to the user, the label will be correctly displayed as an Air Quality Indicator.
The mains steps are:
- Inclusion of the libraries needed (TheThingsNetwork.h, CayenneLPP.h and DHT.h).
- Definition of AppEUI and AppKey.
- Definition of the Frequency plan (the correct value here is Super Important. For Europe the correct value is 868MHz).
- Definition of type of Temperature and Humidity sensor (there are different types on the DHT family).
Then, on the initial setup (executed once)
- The msg STATUS is printed on the serial port. Then all the corresponding information is displayed with the ttn.showStatus().
- The msg JOIN is printed on the serial port. The node sends the request to join the network, this is achieved with ttn.join(appEui, appKey). Notice how the two parameters defined previously (appEui, appKey) are being used for this.
- The DHT sensor is initiated too.
Then on the loop (executed permanently)
- Cayenne LPP buffer is resetted.
- Temperature and Humidity are read form the sensor by using the corresponding DHT library. Output from the sensor is provided on a Digital Format.
- For the Air Quality sensor the output is provided on an Analog format, this means a voltaje between 0v and VCC. Due to the current availability of pins on the Arduino Leonardo board, the Air Quality sensor was powered with 3, 5V. This also means that the output was located between 0 and 3, 5V. To facilitate the treatment of the information, the 5V were emulated multiplying the signal received from the sensor by a factor of 1, 43.
- Having all the information available, the next step is to convert the payload to the Cayenne LPP format and then send it to the TTN gateway by using the LoRa Chip included in the MicroController. These 2 steps are achieved by using the libraries CayenneLPP & TheThingsNetwork.
- The values of Temperature, Humidity and Air Quality are printed on the serial port, just for debugging purposes.
And finally a last but very important detail:
TTN works on a open frequence range that can be used with no license. It means that there will be a lot of devices trying to get connected and send information at the time. To make sure that everybody has access to the resources a Fair Access Policy is needed where the frequency of the transmissions is limited. Based on previous experiences of the Project team, if the Fair Access Policy is not respected the node will just be flapping getting connected and disconnected permanently.
Finally, on The Things Network’s public community network, we have a Fair Access Policy that limits the uplink airtime to 30 seconds per day (24 hours) per node and the downlink messages to 10 messages per day (24 hours) per node. If you use a private network, these limits do not apply, but you still have to be compliant with the governmental and LoRaWAN limits.
https://www.thethingsnetwork.org/docs/lorawan/duty-cycle.html
- Knowing about the Fair Access Policy a timer is needed to wait for a moment before the loop is restarted again. Currently each node is sampling Temperature, Humidity and Air Quality each 10 mins.
In case more details are needed, the code is available at the end of this page. The Project Team did an effort to explain the code in the best way, making the use of comments.
DC: Connection to the TTN gateway and forwarding of the information to the application.Here below the serial output from a node while it's joining successfully the network (some keys have been removed). It can be noticed how the frequencies are located about the 868MHz (the standard for Europe).
13:55:03.224 -> -- STATUS
13:55:03.224 -> EUI: XXXXXXXXXXXXXX
13:55:03.224 -> Battery: 3304
13:55:03.248 -> AppEUI: XXXXXXXXXXXXXX
13:55:03.248 -> DevEUI: XXXXXXXXXXXXXX
13:55:03.248 -> Data Rate: 5
13:55:03.281 -> RX Delay 1: 1000
13:55:03.281 -> RX Delay 2: 2000
13:55:03.281 -> -- JOIN
13:55:03.879 -> Model: RN2483
13:55:03.879 -> Version: 1.0.1
13:55:03.912 -> Sending: mac set deveui XXXXXXXXXXXXXX
13:55:03.912 -> Sending: mac set adr off
13:55:03.912 -> Sending: mac set deveui XXXXXXXXXXXXXX
13:55:03.945 -> Sending: mac set appeui XXXXXXXXXXXXXX
13:55:03.945 -> Sending: mac set appkey XXXXXXXXXXXXXX
13:55:03.945 -> Sending: mac save
13:55:05.140 -> Sending: mac set rx2 3 869525000
13:55:05.173 -> Sending: mac set ch drrange 1 0 6
13:55:05.173 -> Sending: mac set ch dcycle 0 799
13:55:05.173 -> Sending: mac set ch dcycle 1 799
13:55:05.207 -> Sending: mac set ch dcycle 2 799
13:55:05.207 -> Sending: mac set ch dcycle 3 799
13:55:05.207 -> Sending: mac set ch freq 3 867100000
13:55:05.240 -> Sending: mac set ch drrange 3 0 5
13:55:05.240 -> Sending: mac set ch status 3 on
13:55:05.240 -> Sending: mac set ch dcycle 4 799
13:55:05.240 -> Sending: mac set ch freq 4 867300000
13:55:05.273 -> Sending: mac set ch drrange 4 0 5
13:55:05.273 -> Sending: mac set ch status 4 on
13:55:05.273 -> Sending: mac set ch dcycle 5 799
13:55:05.273 -> Sending: mac set ch freq 5 867500000
13:55:05.324 -> Sending: mac set ch drrange 5 0 5
13:55:05.324 -> Sending: mac set ch status 5 on
13:55:05.324 -> Sending: mac set ch dcycle 6 799
13:55:05.324 -> Sending: mac set ch freq 6 867700000
13:55:05.376 -> Sending: mac set ch drrange 6 0 5
13:55:05.376 -> Sending: mac set ch status 6 on
13:55:05.376 -> Sending: mac set ch dcycle 7 799
13:55:05.376 -> Sending: mac set ch freq 7 867900000
13:55:05.376 -> Sending: mac set ch drrange 7 0 5
13:55:05.376 -> Sending: mac set ch status 7 on
13:55:05.437 -> Sending: mac set pwridx 1
13:55:05.437 -> Sending: mac set retx 7
13:55:05.437 -> Sending: mac set dr 5
13:55:05.437 -> Sending: mac join otaa
13:55:10.617 -> Join accepted. Status: 00000401
13:55:10.617 -> DevAddr: 26012F21
13:55:15.629 -> -- LOOP
13:55:15.674 -> 78
13:55:15.674 -> 111.54
13:55:15.674 -> 111
13:55:15.674 -> Sending: mac tx uncnf 1 016700D20268720365006F
13:55:17.786 -> Successful transmission
13:55:17.786 -> Temperature: 21
13:55:17.786 -> Humidity: 57
13:55:17.786 -> AirQuality: 111
While working with the Air Quality sensor it was noted that 1 of the 3 sensors was giving systematically an output slightly higher than the other 2. This was found by locating the 3 sensors (with the corresponding 3 MicroControllers) on the same location. After noticing this situation, it was decided to assign the sensor with the always higher output to the node 3 (used only for testing). The other 2 sensors (with similar outputs) were assigned to nodes 1 and 2, which are the ones considered on the scope of the prototype.
With the aim of benefiting more from LoRa a test was done: After testing the nodes 1 and 2 during a moment and after seeing a solution working on a reliable way, the Project Team decided to take the node 2 and place it on another building. The distance between the node 2 and the gateway was now more than 260m, with lots of houses in between.
This is the exact moment where the node 2 was connected successfully, the Project Team was very excited!
Jumping for a moment to the application (where the data will be visualized), it can be easily recognized how just before 10pm the SNR indicated on the node 2 drooped strongly after the move. Nevertheless, the solution kept working fine.
For the purposes of the project, the application myDevices was used.
First of all, an account should be created on their website:
Then the devices can start being added, on the category TTN, the device "the Things Uno" can be found.
Then the corresponding data should be entered so the device can be recognized accordingly.
By doing these, the nodes will be included on the platform and then they will be ready to be used. This can be seen on the screen below.
The final dashboard on the web interface looks like that:
And it is available here:
https://cayenne.mydevices.com/shared/5f016bf9518adb4d4a6321b5
Top of the page:
Illustrates Air Quality, together with Temperature and Humidity. This for Place 1 and Place 2. The Air Quality number displayed shows in fact how bad the air is. For instance: An indicator at "30" shows very fresh air, an indicator at "150" shows very bad Air Conditions.
Bottom of the page:
Illustrates the Signal/Noise Ratio (SNR). It is used by the Project Team as double check, to confirm that the data is being consistently received from the TTN nodes. This information is more for administration purposes and it could be removed from the End User's view.
Possible Improvements on a next version:- Current values displayed have no decimals. The use of sensors with at least 1 decimal could be considered on a next version.
- If needed by customer, the usage of a particular Air Quality sensor could be used, to follow closely a particular type of gas.
- Also, if needed by customer, other elements could be measured such as good or bad luminosity and even noise pollution on the offices.
- Alarms like mails or SMS could be configured, depending customer needs. These alerts are provided by the application being used.
- With a bigger focus on functionality (and less in appearance) the general look of the prototype has a lot of place to improve:
To better illustrate the connectivity, a very basic schematic is included at the end of this page.
- As always, some minor improvements on the code are always possible.
Important Updates on 2020-07-26After a close follow-up of the entire solution during about 3 weeks, the Project Team has noticed a couple of important points that deserve to me mentioned here:
A) The connectivity for the nodes is indeed influenced by their location.
Just after the project was finalized early in July, the Project Team expected to have all the 3 Nodes (2 of them in production and 1 of them, being used just for testing purposes) connected and sending data permanently. The data from Node 1 (Site 1) and from testing Node 3 (located on the same building where the gateway is) were connected permanently, transmitting without any issue.
On the other hand, the connectivity for Node 2 (located on the site 2) has been much less reliable. There have been long periods where no data has been received from Site 2. Here below a screenshot taken right now from the TTN console, showing the traffic for the application defined for this project. It can be noticed that Data is received from Node 1 (and also from testing Node 3) but not from Node 2:
The exact cause for this situation is still not clearly defined. These interruptions might be due to external factors, having a direct impact on the signal since the moment it's sent by the node until the moment it's received (or not) by the TTN Gateway.
With the purpose of having more details, the Project Team checked closely the graphics of the Signal/Noise Ratio (SNR) for each node. On the graphics, it can be found clearly the difference for the 2 locations:
For the node on the location 1, it can be found a quite stable graphic, with no significative changes.
For the node on the location 2, on the other hand, checking the SNR graphic big changes can be found. The changes don't seem to follow any clear pattern. They might be due to environmental factors. In yellow is highlighted the time when no data at all was received from the Node 2 (few days).
What could be done? Possible adjustments to improve this could be: Relocating the indoor TTN gateway, placing it differently. As an extreme solution, an Outdoor TTN gateway could be also considered.
B) The reliability of the data being reported by the nodes is not 100%
After the project was finalized, the Project Team expected to have data absolutely reliable at 100%. Data was indeed reliable most of the time, however, once in a while node 2 started providing completely incorrect values for the Air Quality. Here below an example.
Given the fact that Node 2 is located on a different location (where the Project Team has no access) the checks need to be done remotely, with the great support of people the Site 2. Checks included asking questions and giving some basic indications, all this by phone (with no physical access to the node itself). People on site confirmed that no chemicals were placed directly next to the sensor, they also confirmed that no major change happened on the location of the node, no changes on the site (no construction works, etc). They did indicated that the node is sometimes exposed to a much more direct sunlight which might be having a strong influence on the reliability of the value provided by the sensor.
What could be done? Possible adjustments to improve this could be: Relocating the node on the Site 2, this to avoid strong changes on the local conditions. Another option could be working not with only 1 sensor, but rather with a set of sensors (2 or 3 for instance) to then discarding the values that are clearly incorrect. Another alternative could be working with industrial sensors, being probably more reliable.


Comments