


Hardware components | ||||||
| × | 1 | ||||
| × | 1 | ||||
| × | 1 | ||||
| × | 1 | ||||
 |
| × | 1 | |||
| × | 1 | ||||
| × | 1 | ||||
Software apps and online services | ||||||
| ||||||
 |
| |||||
| ||||||
This project was build during the IoT Hackathon "CEBIT IoT labs- A Hackathon for IOT enthusiasts!" arranged by Venturesity and CeBIT along with the Partners: Intel, BOSCH and DigitalOcean conducted on 9th and 10th December in Bangalore International Exhibition Centre (BIEC Bangalore).
Problem Statement and Solution:Transportation of temperature sensitive goods needs constant monitoring of the ambient temperature conditions for delivery of consignment in a quality state.
In transporting perishable product, it’s becoming ever more important to provide records of the temperatures, and in some cases, humidity, to which cargo has been exposed. Food items such as fruit, meat and fish cannot be shipped long distances without refrigeration. In some instances, chilling to 13°C (55°F) is sufficient for produce to be sold fresh (or that does not freeze readily) such as bananas.
Vaccines and blood products are examples of medical products needing strict temperature control. The need for temperature control extends beyond products for human consumption. Some specialist paints or coating materials will be damaged by exposure to low temperatures. Other chemicals must be kept within strict temperature limits during transportation. The potency of a medical drug can be profoundly degraded by changes in temperature. Some products may also be affected by exposure to adverse humidity levels. It is not always possible completely to prevent degradation during transport, but damage can be minimized through good handling and storage practices, by qualifying the mode and route of transport, and by using qualified packaging.
Organizations contracting to ship perishable products often specify the permissible temperature range. However, even if it is possible to show that product was exposed to conditions outside of those contracted, proving where it happened, and thus responsibility, can be much harder.
For quality assurance purposes, stakeholders in the supply chain must be able to supply documentary evidence that the drug product has not exceeded the acceptable limits of time, temperature and humidity exposure, as determined by the drug manufacturer’s stability data for the product. This evidence is supplied by recording devices and technologies that provide a history of exposure to temperatures and/or humidity during transport and external distribution. The answer is to create a location and time-based record of the temperatures experienced and upload it to a cloud server in real time.
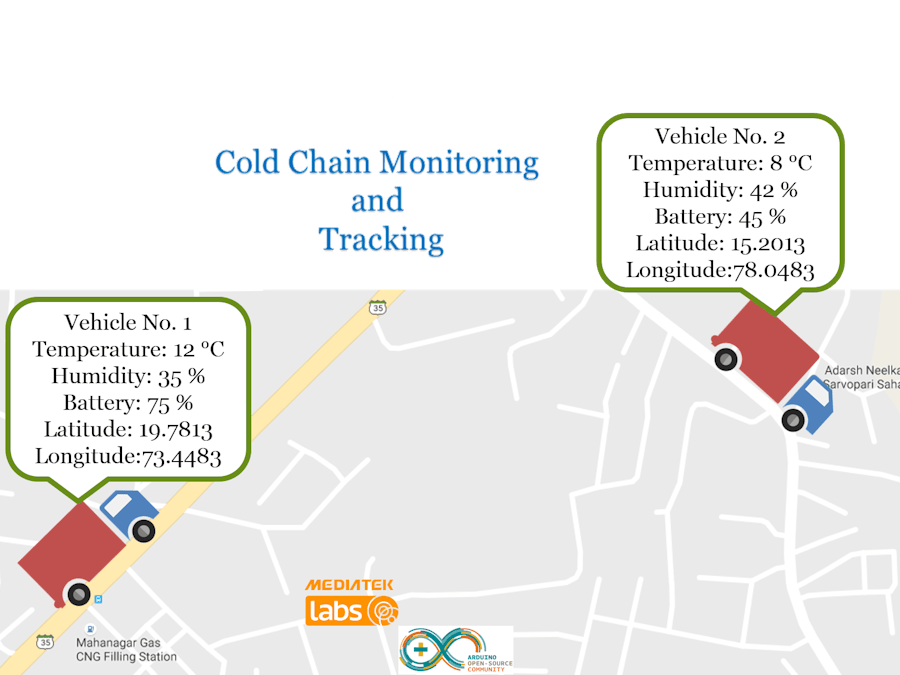
Our prototype is an IoT based solution to make delivery of temperature sensitive perishable products more efficient. The device with GPS connection has a unique ID so as to recognize which vehicle it is and what the vehicle is carrying. The temperature and humidity sensor is interfaced to monitor the temperature and humidity periodically. The sensor data along with the Unique ID, GPS co-ordinates and battery level is sent to PubNub Cloud service. So that the temperature and position of each delivery vehicle can be monitored in real time remotely through a PC, smart phone, or tablet. A RTC is also connected for logging time-based record of the temperatures experienced along with the location. All data values are stored in a SD card memory. Other sensors could be added: like an accelerometer to detect when the door opens.
Advantages:- Minute-by-minute temperature and humidity report while the truck is on the road.
- Track shipment location. Ensure that trucks operate on the designated route.
- Works in offline recording mode in case of no GSM/GPRS.
- Temperature and Humidity violation alerts through SMS or email.
Useful for transportation of:
- Frozen food
- Perishable goods like fruits/vegetables with a life span of a week and diary products.
- Food items like ice-creams that require cold storage.
- Vaccines and temperature-sensitive pharmaceuticals.
- Health products.
Applications:
- Refrigerated containers/trucks/vans.
- Fleet management of cold storage vehicles.
- Catering trucks.
To create PubNub apps for data streaming, you should first register for a PubNub account. The PubNub app serves as an interface between your device and the network. Once you've registered your PubNub account a default project is created, as shown below.
Click on this app and copy the Publish Key and Subscribe Key. The Publish Key and Subscribe Key define the app and will be used in your Arduino sketch to communicate the data from the board to the PubNub Data Stream Network.
1) Open Arduino IDE and by default a new sketch is created and displayed.
2) Save that sketch as "ColdStoragev1_0.ino".
3) Add the PubNub.h and PubNub.cpp files to the same directory as your ColdStoragev1_0.ino project. Those libraries are present in the code section. To Publish and subscribe data to PubNub we require this library.
4) Download Grove_Temper_Humidity_TH02 library and install the library into Arduino libraries. To read the temperature and relative humidity information at the same time from Grove TH02 sensor.
5) Download and Install the ArduinoJson Library. Data can be published or subscribed to PubNub in JSON format only so we require this library.
6) Download and Install the RTCLin.
7) Change the Reporting Interval based on your requirement:
unsigned long ReportingInterval = 20000;
// How often do you want to update the IOT site in milliseconds (in this case 20 seconds)
8) Change the pubkey and subkey with the Publish Key and Subscribe Key respectively. And give any suitable name for the channel we will require it afterwards.
//define the required keys for using PubNub
char pubkey[] = "pub-c-3754af37-b56d-406b-870c-424b2eba49ea";
char subkey[] = "sub-c-d4cf22c8-bdf2-11e6-b490-02ee2ddab7fe";
char channel[] = "my_channel";
8) Give a name to the file in SD card where all the data will be logged
LFile dataFile = LSD.open("datalog.csv", FILE_WRITE);
1) Create a new folder with the name as "Cold-Storage-Monitoring-and-Tracking".
2) Download the "Cold-Storage-Monitoring-and-Tracking-master.zip".
3) Now unzip this inside the "Cold-Storage-Monitoring-and-Tracking" folder.
4) Now go inside the "Cold-Storage-Monitoring-and-Tracking-master" folder you will find the "Cold Storage Monitoring and Tracking code v1.0" inside which lies the "Dashboard Code" folder. Open it.
5) You will find "public.rar" and extract it here inside the "Dashboard Code" folder.
6) Inside the extracted "public" folder you will find the "index.html" file.
7) The folder structure should look like this:
8) You need to install the following node modules here inside the "Dashboard Code" folder:
npm install pubnub socket.io express
C:\Users\Adm\Desktop\Cold-Storage-Monitoring-and-Tracking-master\Cold Storage Monitoring and Tracking code v1.0\Dashboard Code>npm install pubnub socket.io express
9) "Dashboard code" folder contains the server.js which is a node.js code. In the server.js code change the publish and subscribe key.
//Local Server needs only to subsribe pubnub but for demo we are using publish
pubnub = new PubNub({
       publishKey : 'pub-c-3754af37-b56d-406b-870c-424b2eba49ea',
//replace with your publish key

        subscribeKey : 'sub-c-d4cf22c8-bdf2-11e6-b490-02ee2ddab7fe'
//replace with your subscribe Key
   })
10) You need to subscribe to the channel and so change the channel name with the same name as you set in the Arduino sketch previously.
//subscribing to pubnub for getting sensor data published by LinkIt One
pubnub.subscribe({
   channels: ['my_channel']
})
1) Go to https://developers.google.com/maps/.
2) Login with your gmail account.
3) Now go to https://developers.google.com/maps/documentation/javascript/.
4) Click on "GET A KEY".
5) After clicking on "GET A KEY" a pop-up window will open; give a suitable project name and click on "Yes" and then click on "CREATE AND ENABLE API".
6) Copy the KEY, you will need it in the Node.js code.
7) Inside the public folder of Dashboard code you will find a "index.html" file. Open it in a Notepad++ and paste the Google Map API key by replacing the "YOUR_API_KEY".
</script>
 <script src="https://maps.googleapis.com/maps/api/js?key=YOUR_API_KEY&callback=initMap" async defer>
</script>
 </body>
8) Run the nodejs server by running the following command inside the command prompt (you need to run this command where the server.js file is present).
9) Open the localhost:8080 or IP Address:8080 to see the real time dashboard.
Go to the following link: "https://www.pubnub.com/docs/console#" or you can go to the debug console via pubnub.com by clicking on "Developers" section and then click on the "debugging console".
Then paste the publish key, subscribe key and channel name so that you can view all the PubNub events (publish and subscribe both).
Click on the "SUBSCRIBE" button so that you can view the data.
All the data can be viewed in JSON format:


Comments