


Hardware components | ||||||
| × | 1 | ||||
 |
| × | 1 | |||
Software apps and online services | ||||||
 |
| |||||
Hand tools and fabrication machines | ||||||
 |
| |||||
 |
| |||||
In several of my previous projects I have presented ways to make weather stations, but this time I decided to make it a specialized device with a strictly defined purpose. Namely, at least in my experience, the basic weather information for planning any activity in the coming days is whether there is a chance of rainfall in that period. Unfortunately, in commercial, and even most DIY weather stations, this information is either not available at all or is quite brief in the form of a current day rainfall forecast. That's why this time I decided to create a specialized weather station with the purpose of providing detailed information about the possibility of precipitation in the current and next five days.
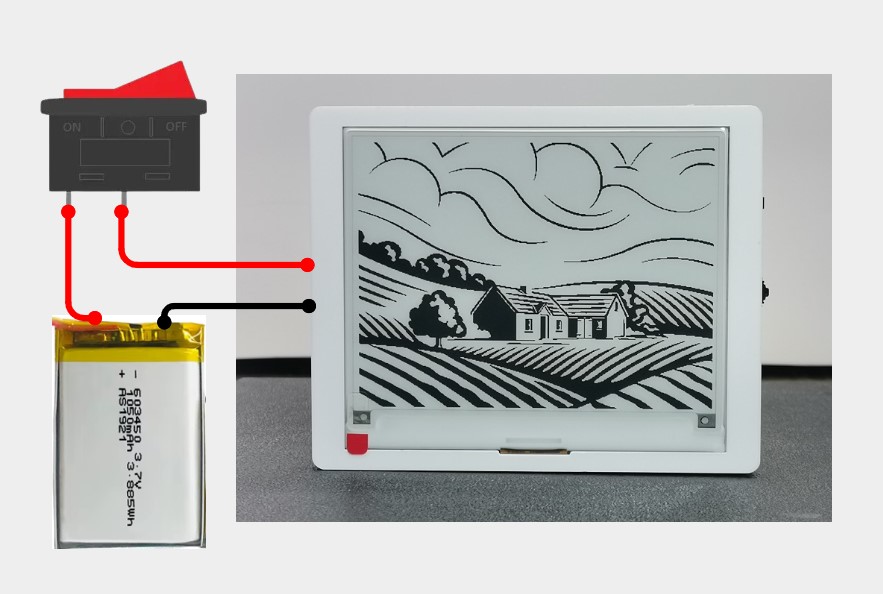
For this purpose, data from openweathermap is used where you can create a free API key. The display shows the predicted amount of precipitation in mm, the time of day in which it is predicted, as well as the percentage probability of rain on a specific day. Specifically, in this project I used the CrowPanel ESP32 4.2” E-paper Display module with built-in ESP32S3 MCU. It is very practical in the sense that there is no need to connect components and solder, and it has multiple IO ports, a microSD slot, multiple buttons, and even a battery charger circuit.
Don't miss the PCBWay Christmast Big Sales from November 28th to December 31st. Get free christmas coupons and Redeem or check value a promo code. You ca also start with a PCB Order for Only $5. Up to 50% off for 3D printing & CNC Machining and Special Sales in PCBWay Store!PCBWay has all the servicesto create your project at the best price.
At first glance, you can see that I didn't pay special attention to the visual part of the display, in the sense that there are no advanced graphic shapes and images, but only rectangles that represent the days, so the required information can be determined very fast and easily.
Now let's explain how it works and describe the information displayed on the screen.
In the upper right part there is a space where the current situation regarding rainfall is indicated, as well as the forecast until the end of the current day. The space is divided by horizontal and vertical dashed lines. The vertical ones show the time (24 hours) midnighth, 6AM, noon, 6PM and midnight. The horizontal lines serve for a more precise orientation for the predicted rainfall amounts in mm. The numbers on the left edge show the value of this parameter. It is very important to emphasize that for better visibility this value is variable and depends on the maximum amount of precipitation in a 3-hour period, which is predicted for that day.
So as I mentioned, the amount of precipitation is predicted at a distance of 3 hours and is expressed through vertical bars. At the top is the day of the week as well as the POP symbol, which in translation means probability of precipitation and is indicated in the unit Percentage.
Now in this case each day is divided by four horizontal and two vertical lines. The horizontal lines serve for a more precise visual assessment of the amount of precipitation, and the vertical line indicates the time: midnight, noon, and midnight. As before, precipitation is represented graphically with vertical bars. With the free API key from openweathermap we get precipitation data with a resolution of 3 hours.If no precipitation is predicted for a particular day, then the message NO RAIN appears in the middle of the rectangle indicating the particular day.
Now a few words about the code and some settings in it: Before uploading it, we need to enter some into the code. First, we need to enter the credentials of the local Wi-Fi network. I specifically use the device in two places with different Wi-Fi networks, so in order not to change the credentials constantly, I made this part of the code in a way that the data from the two available networks is entered, and the device connects to the currently available Wi-Fi network. In fact, this is a very practical option, and you can enter any number of wireless networks.
Then we enter the previously generated API key for the specific location from the openweathermap site, as well as the coordinates (latitude and longitude). Also in the "void syncTime" function in the "config time" line we need to enter the difference between UTC and local time in seconds. (For my location, local time is UTC + 2h, so I put 7200 sec).
I created separate functions for each part of the screen so the code is easy to understand and customizable, so we can change multiple parameters such as the width of the bars, imperial or metric units, font, and others.
During testing, I noticed that the readability of the display in a poorly lit room improves if the colors on the screen are inverted. For this reason, I added an option for inverted colors (negative) by pressing a button on the device during boot. When refreshing (updating the screen) the color scheme does not change.
The device is currently set to check for new data on openweathermaps every 15 minutes (this can be easily changed at the end of the code), and then goes into the so-called DEEP SLEEP mode. In this mode, the consumption is almost 0. In this way, the battery lasts an exceptionally long time, which is one of the positive features of e-paper displays.
If for some reason the data from openweathermaps is not downloaded, all data is 0.0 and "-1" appears on the Current Weather screen in UT, which is a sign of an unsuccessful download. The data will be downloaded in next 15 minutes, or immediately, if we press the reset button or the off/on switch.
Now let's briefly see how the device works in real conditions. When turned on, we can follow the entire boot process on the serial monitor and determine if there is any error. If it passes without errors, the data is printed on the screen and the weather station enters DEEP SLEEP mode for the next 15 minutes. Below are several screenshots from different time periods and at different stages of the device's development.
This is elegant e-paper weather display that shows current conditions and 5-day Rainfall (Percipitation) forecasts using ESP32 and OpenWeatherMap API. Perfect for makers who want a low-power, always-on specialized weather station with excellent functionality and crisp daylight visibility!


Comments