/*
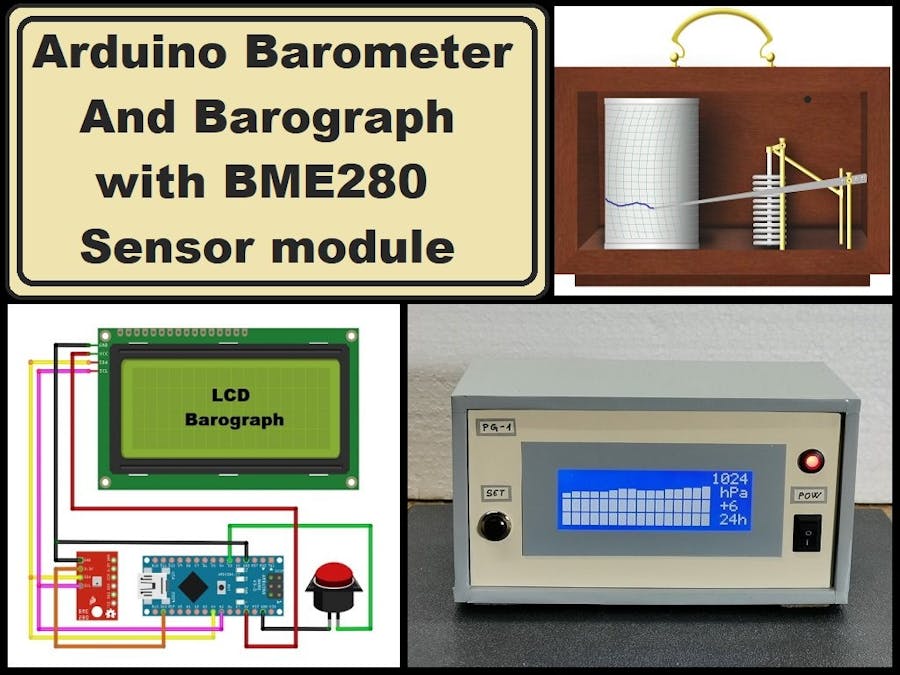
Barometer with digital and graphic display of atmospheric pressure data.
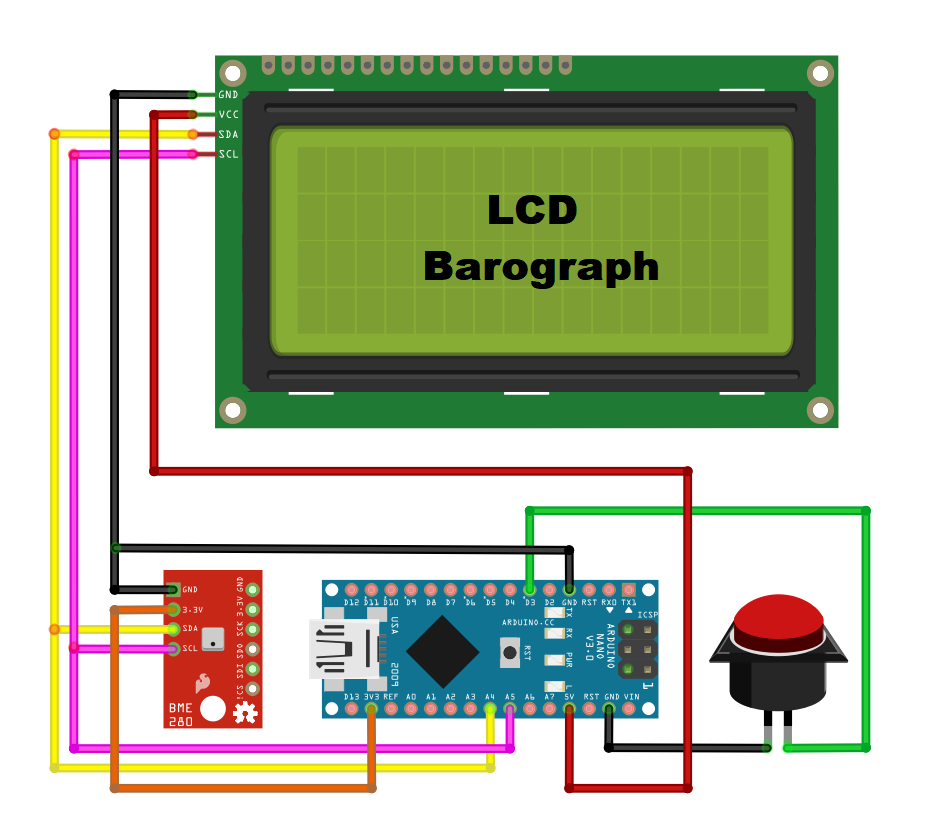
Components: Screen text LCD 2004, platform: arduinio nano/uno (Atmega328 or more), pressure sensor: BME 280.
Amatroskin 2022.
*/
#include <LiquidCrystal_I2C.h>
#include <Wire.h>
#include "GyverButton.h"
#include <Adafruit_Sensor.h>
#include <Adafruit_BME280.h>
#define SEALEVELPRESSURE_HPA (933,17) // Set the height
#define BTN_PIN 3 //Button Pin
#define BASE_PERIOD 675000 //Main array acquisition period 675000ms = 11.25 min (*16 bars = 3 hours) maximum graph resolution
#define MIN_VAL 990 //The minimum value displayed on the chart
#define MAX_VAL 1035 //The maximum value displayed on the graph
LiquidCrystal_I2C lcd(0x27, 20, 4); //We create the necessary objects
GButton butt1(BTN_PIN);
Adafruit_BME280 bme;
uint32_t tmr1, tmr2; //timer variables
uint32_t set_period = BASE_PERIOD; //Display period, changes in multiples of 3 hours (3, 6, 12, 24)
int16_t plot_array[20]; //Data array for drawing a chart
uint16_t base_array [128]; //The base array stores all measurements for the last 24 hours (128 cells * 11.25 minutes = 1440 minutes = 24 hours)
int16_t value, delta; //Current (taken) readings, difference in readings for a selected period of time
byte interval = 1; //Interval displayed on the screen (time difference between adjacent chart bars)
// 11.25 min * 16 = 3 hours, 22.5 min - 6 hours, 45 min - 12 hours, 90 min - 24 hours
void setup() {
read_all ();
// Serial.begin(9600);
attachInterrupt(1, isr, CHANGE);
butt1.setDebounce(80); // anti-bounce setting (default 80 ms)
butt1.setTimeout(300); // hold timeout setting (default 500ms)
lcd.init();
lcd.backlight();
lcd.clear();
if (!bme.begin(0x76)) { //Initialization of the BME280 sensor at address 0x76 (default)
//Serial.println("Could not find a valid BME280!");//Printing an Error Message to the Port Monitor
lcd.setCursor(3, 1);
lcd.print(F("No connection")); //___________________________or on the screen
lcd.setCursor(5, 2);
lcd.print(F("to sensor"));
while (1); //won't go without a sensor.
}
if (!digitalRead(BTN_PIN)) { //Reset settings when turned on with the button held down
for (byte i = 0; i < 128; i++) base_array [i] = 0; //Erase data
update_all (); //Save
lcd.setCursor(5, 1); //Report it
lcd.print(F("Reset data"));
lcd.setCursor(9, 2);
lcd.print(F("OK"));
}
while (!digitalRead(BTN_PIN));
lcd.clear();
initPlot(); //Initializing Symbols for Rendering
value = round ((bme.seaLevelForAltitude(700, bme.readPressure())/100));//We take the current readings, convert to mm Hg.
base_array[0] = value;
get_data ();
}
void isr() { //We poll the button in the interrupt to catch the click anyway
butt1.tick();
}
void loop() {
butt1.tick(); //Poll button
if (butt1.isClick()) { //When you press:
interval *= 2; //Switching the chart scale
if (interval > 8) interval = 1;
set_period = BASE_PERIOD * interval; //Recalculate the interval for updating data from the sensor
get_data (); //Update information on the display
}
if (millis() - tmr1 >= BASE_PERIOD) { //We collect the basic array of data
tmr1 = millis(); //Every 11.25 minutes we take readings from the sensor
for (int i = 126; i >= 0; i--) { //Shift the entire array by one point
base_array[i + 1] = base_array[i];
}
value = round ((bme.seaLevelForAltitude(700, bme.readPressure())/100));//Convert to mm/Hg.
base_array[0] = value; //Write the latest readings to an array
update_all (); //And remember in EEPROM
}
if (millis() - tmr2 >= set_period) { //After a period of time set_period (milliseconds)
tmr2 = millis(); //Refreshing the data on the screen
get_data ();
}
}
void get_data () { //We draw 16 columns of the diagram on the screen
for (int i = 15; i >= 0; i--) {
drawPlot(0, 3, 16, 4, MIN_VAL, MAX_VAL, (base_array[i * interval]));
}
delta = ((base_array[0]) - (base_array[15 * interval])); //We calculate the delta (pressure change) for the selected interval
screen_data (value, delta, (interval * 3)); //Displaying text information on the screen
}
void screen_data (int value, int delta, byte interval) { //The function of displaying text information on the screen (everything except for the chart bars)
lcd.setCursor(16, 0);
lcd.print(value);
lcd.setCursor(17, 2);
if (delta == value) delta = 0;
if (delta > 0) {
lcd.print("+");
} else if (delta < 0) {
lcd.print("-");
} else if (delta == 0) {
lcd.print(" ");
}
lcd.setCursor(18, 2);
lcd.print(abs(delta));
if (abs(delta) < 10) {
lcd.setCursor(19, 2);
lcd.print(" ");
}
lcd.setCursor(17, 1);
lcd.print("hPa");
lcd.setCursor(17, 3);
lcd.print(interval);
(interval < 10) ? lcd.print("h ") : lcd.print("h");
}
void initPlot() {
// necessary symbols for work
// created in http://maxpromer.github.io/LCD-Character-Creator/
byte row8[8] = {0b11111, 0b11111, 0b11111, 0b11111, 0b11111, 0b11111, 0b11111, 0b11111};
byte row7[8] = {0b00000, 0b11111, 0b11111, 0b11111, 0b11111, 0b11111, 0b11111, 0b11111};
byte row6[8] = {0b00000, 0b00000, 0b11111, 0b11111, 0b11111, 0b11111, 0b11111, 0b11111};
byte row5[8] = {0b00000, 0b00000, 0b00000, 0b11111, 0b11111, 0b11111, 0b11111, 0b11111};
byte row4[8] = {0b00000, 0b00000, 0b00000, 0b00000, 0b11111, 0b11111, 0b11111, 0b11111};
byte row3[8] = {0b00000, 0b00000, 0b00000, 0b00000, 0b00000, 0b11111, 0b11111, 0b11111};
byte row2[8] = {0b00000, 0b00000, 0b00000, 0b00000, 0b00000, 0b00000, 0b11111, 0b11111};
byte row1[8] = {0b00000, 0b00000, 0b00000, 0b00000, 0b00000, 0b00000, 0b00000, 0b11111};
lcd.createChar(0, row8);
lcd.createChar(1, row1);
lcd.createChar(2, row2);
lcd.createChar(3, row3);
lcd.createChar(4, row4);
lcd.createChar(5, row5);
lcd.createChar(6, row6);
lcd.createChar(7, row7);
}
//Diagram drawing, code taken from Guyver https://alexgyver.ru/lcd-plots-and-bars/
void drawPlot(byte pos, byte row, byte width, byte height, int min_val, int max_val, int fill_val) {
for (byte i = 0; i < width; i++) {
plot_array[i] = plot_array[i + 1];
}
fill_val = constrain(fill_val, min_val, max_val);
plot_array[width - 1] = fill_val;
for (byte i = 0; i < width; i++) { // each parameter column
int infill, fract;
// find the number of whole blocks, taking into account the minimum and maximum, to display on the chart
infill = floor((float)(plot_array[i] - min_val) / (max_val - min_val) * height * 10);
fract = (infill % 10) * 8 / 10; // find the number of remaining stripes
infill = infill / 10;
for (byte n = 0; n < height; n++) { // for all graph lines
if (n < infill && infill > 0) { // while we're below the level
lcd.setCursor(i, (row - n)); // fill in cells
lcd.write(0);
}
if (n >= infill) { // if you reach the level
lcd.setCursor(i, (row - n));
if (fract > 0) lcd.write(fract); // заполняем дробные ячейки
else lcd.write(16); // if fractional == 0, fill empty
for (byte k = n + 1; k < height; k++) { // everything that is on top is filled with empty
lcd.setCursor(i, (row - k));
lcd.write(16);
}
break;
}
}
}
}
void update_all () { //Обновляем данные в EEPROM
eeprom_update_block((void*)&base_array, 0, sizeof(base_array));
}
void read_all () { //Reading data from EEPROM
eeprom_read_block((void*)&base_array, 0, sizeof(base_array));
}


Comments