


Hardware components | ||||||
 |
| × | 1 | |||
| × | 1 | ||||
| × | 1 | ||||
| × | 1 | ||||
Software apps and online services | ||||||
| ||||||
| ||||||
 |
| |||||
 |
| |||||
The Beacons Are Lit! Jenkins Calls for Aid!
Reposted from here by Mike Fettis
How do you notify a developer when a build fails in Jenkins without bombarding them with messages in Slack or email? Turn on a beacon to gather their attention. Great, now we have a light flashing away. That's awesome, but how do we turn it off? Build a bot; let the bot handle it. The whole system has to bounce in and out of a secure network, a less secure IoT network and out on the public internet - what could go wrong? Finally, this is DevOps so we have to monitor and instrument everything we do; let's toss a little Splunk in there and build a separate Jenkins pipeline for updating and deploying the chatbot.
Hardware- Wifi networks
- VM to run Docker images on, because everything is better with Docker.
- Jenkins
- Slack
- Node.js
- Docker
- Arduino
- MQTT message broker
- Splunk with http collectors
- Docker logging driver.
When there is a Jenkins build failure, an alert is posted to a Slack channel. In order for a developer to know there is an error they need to constantly monitor Slack, which is a sub-optimal use of time.
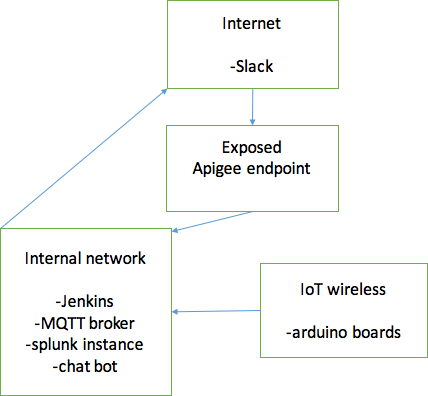
Beacon SolutionWe want a developer to be notified in the real world when there is a build failure without breaking their productivity. Enter the beacons. Let's take a step back and explain the topology that we are working with.
The reason for network segmentation is because IoT and public slack should be treated differently than our internal network. All the IoT toys live in a sanitized network off both the internal network and the internet. Slack, however, lives in the public internet; while communicating to slack is simple, we needed to secure the outgoing webhook from slack to our network via a secure Apigee endpoint.
There is a little bit of prep work that is needed before we get started. First, we needed to sniff the RF codes for the power outlets which meant wiring up an Arduino with a 434 receiver, then hitting the remote buttons for turning the outlets on and off and recording the codes for later use. There is a nice little sketch below which will give you everything that you need.
The next step was to take those codes and leverage some handy little microcontroller boards called the Adafruit esp8266 Huzzah.
Technically, these boards are 802.11 radios with a microcontroller tacked on. But the 8266 community has really run with them. Usually, if you tried to do this with shields and other full bodied Arduino boards, it would cost you 20–50 per board. When you use this package, its only $10 per board and the boards are small. Next, add the radio module to a breadboard and tack on a micro USB breakout so it is easy to power. You end up with something that looks like this.
With the hardware mostly done, it's time to switch to the software for the controller. It is easier to use libraries that someone else wrote instead of doing all the work yourself, so we are going to use the RCswitch, ESP8266wifi and the ESP8266httpclient libraries to handle connecting the 434radio to the Wi-Fi and then an http client library for the Splunk http collector logging. Additionally, I added in a function for a hardware based timer to shut down the beacons after 10 minutes. This way, if we have a build failure after hours, the beacons don’t stay on all night.
Below is the complete sketch for the Arduino with some information redacted, but it has all the meat to connect to the WiFi, connect to the broker, read messages from the broker, control the RF outlets, and then to send log data out to Splunk. The Splunk feature was an add-on after the system got up and running, because if a single node would go offline or have issues reading a message, it was a pain to talk all around the floor and attach an FTDI cable to the board to see what was going wrong. Http collectors are fantastic for this kind of work.
350 lines of code later and you’re back - thanks for sticking around. Now we have the hardware and Jenkins wired up to turn on the beacons. How do we turn them off? Technically, all it takes is posting a message to the message broker saying “off”, which is super easy if you are sitting at a computer in the internal network. It is slightly less easy if you want to do it through Slack, but it is way more fun to write a bot that does it all for you. Enter Opsbot!
Opsbot is pretty straight forward, just an outgoing webhook keyed to a specific word then it listens for a phrase and posts the turn off message. Finally, we couldn’t just expose something directly to the internet and the webhook connecting directly to the internal network. Therefore, we put an Apigee endpoint in between to make sure there was a layer of segmentation in there.
The last step is to build a Jenkins pipeline for Opsbot to run on so that we can just update code directly in git, let it rebuild Opsbot, deploy a Docker image, and fire it up. We also took advantage of the Splunk Docker logging driver, because it uses the same http collectors that were used in the Arduino code. This way we don’t need to deal with any Docker files for logging and the bot can communicate back to Splunk. This also lets us keep track of developer interactions with Opsbot, and you can run sentiment analysis to understand if the developer interactions are positive or negative or if they are trying to mess with the bot.
We built a solution for improving awareness around our build pipeline that anyone can understand. Along the way we were able to play with IoT and hack some hardware.
Finally, some notes and citations because further information is better information:


Comments