

_ztBMuBhMHo.jpg?auto=compress%2Cformat&w=48&h=48&fit=fill&bg=ffffff)

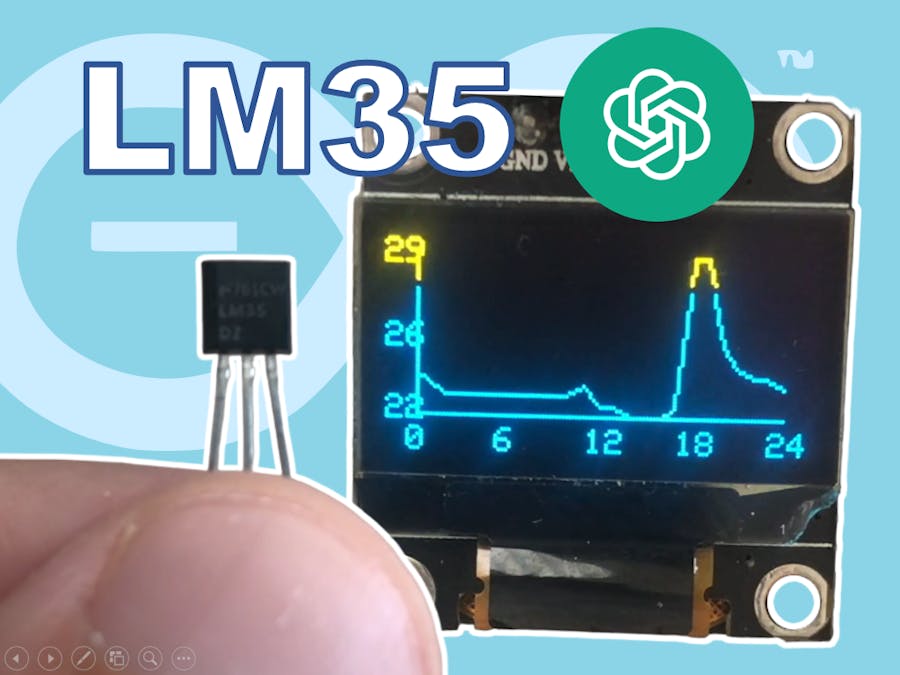
Here is the tutorial that explains how to use LM35 temperature sensor. I hope you find it usefull. Apart from instruction on how to use this sensor, I am also showing how you can engage AI powered by chatGPT to write sections of your code that would require a lot of time and tedious programing to complete, and chat GPT can create that code for you in no time.
In this case it created the linechart that for the temperature readings I recorded.
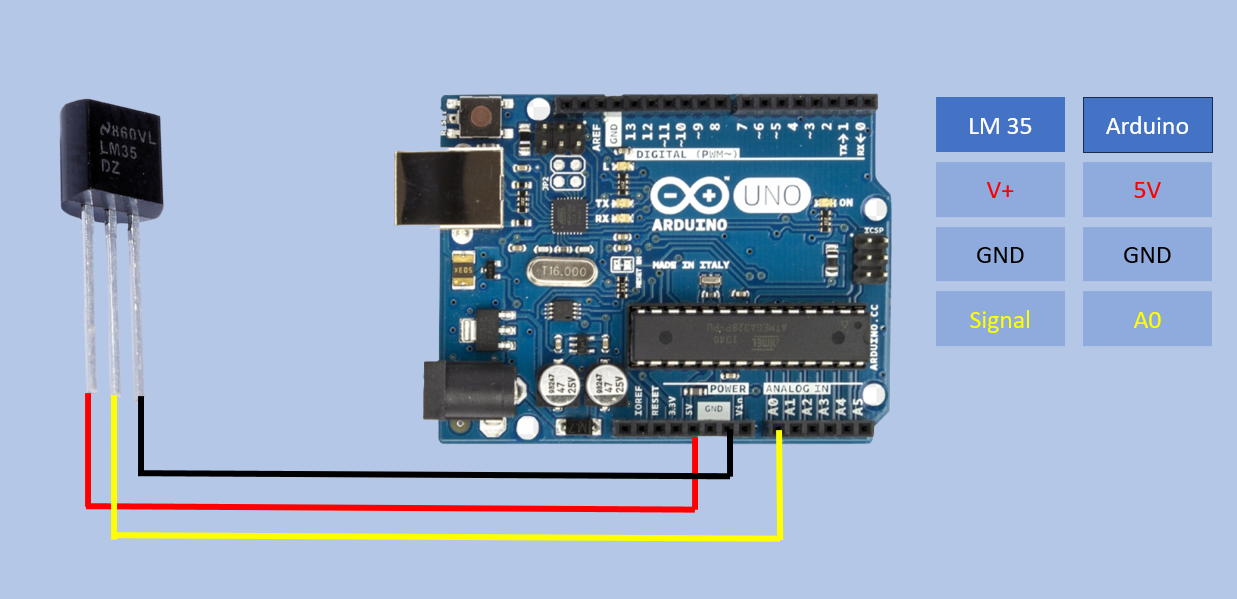
Reading and displaying temerature in Serial Monitor
ArduinoTemperature is displayed in bot Celcius and Farenheit
#define LM35Pin A0
int LM35Read;
float temperature;

void setup() {
  Serial.begin(9600);
}

void loop() {
// Saving reading from A9 to LM35Read variable
  LM35Read= analogRead(LM35Pin);
// Convert the reading to temp. in Celcius
  temperature = LM35Read * (5.0 / 1024.0) *100;
// Print the temperature in Celsius
  Serial.print("Temperature: ");
  Serial.print(temperature);
  Serial.print("°C  ");
// Print the temperature in Fahrenheit
  Serial.print((temperature * 9.0 / 5.0) + 32.0);
  Serial.println("F");
  delay(1000);
}
Program to record temperature and draw temperature time graph
ArduinoThe function drawLineChart was generated by chatGPT.
I still need to tidy this code up so it is not a final version
I still need to tidy this code up so it is not a final version
#include <Wire.h>
#include <Adafruit_GFX.h>
#include <Adafruit_SSD1306.h>

#define SCREEN_WIDTH 128
#define SCREEN_HEIGHT 64

Adafruit_SSD1306 display(SCREEN_WIDTH, SCREEN_HEIGHT, &Wire, -1);

// Program states
// 0 - idle
// 1 - temperature data recording
// 2 - chart display

const int buttonPin = 2;   // The pin number for the button
const int lm35Pin = A0;

int CurrentState=0;
int temperatureValue ;
int numberOfReads=0;
unsigned long readTimestamp=0;
unsigned long buttonPress=0;


// Table to store time and temperature data
int data[50][2];

int dataSize ;
// Variables for scaling and labeling
int minX, maxX, minY, maxY;

void drawLineChart() {

  //dataSize=numberOfReads;

  // Calculate the scaling factors
  float scaleX = (float)(SCREEN_WIDTH - 20) / (maxX - minX);
  float scaleY = (float)(SCREEN_HEIGHT - 20) / (maxY - minY);

  // Draw X and Y axes
  display.drawLine(10, SCREEN_HEIGHT - 10 - 2, SCREEN_WIDTH - 10, SCREEN_HEIGHT - 10 - 2, WHITE);  // X axis
  display.drawLine(10, SCREEN_HEIGHT - 10 - 2, 10, 10 - 2, WHITE);                                  // Y axis

  // Draw X scale labels
  int numLabelsX = 5;  // Number of labels on the X axis
  int stepX = (maxX - minX) / (numLabelsX - 1);
  for (int i = 0; i < numLabelsX; i++) {
    int x = minX + i * stepX;
    int xPos = map(x, minX, maxX, 10, SCREEN_WIDTH - 10);
    display.setTextSize(1);
    display.setTextColor(WHITE);
    display.setCursor(xPos - 3, SCREEN_HEIGHT - 6 - 2);  // Move 2 pixels up
    display.print(x / 60);  // Convert seconds to minutes
  }

  // Draw Y scale labels
  int numLabelsY = 3;  // Number of labels on the Y axis
  int stepY = (maxY - minY) / (numLabelsY - 1);
  for (int i = 0; i < numLabelsY; i++) {
    int y = minY + i * stepY;
    int yPos = map(y, minY, maxY, SCREEN_HEIGHT - 10 - 2, 10 - 2);  // Move 2 pixels up
    display.setTextSize(1);
    display.setTextColor(WHITE);
    display.setCursor(1, yPos - 3 - 2);  // Move 2 pixels up
    display.print(int(y/10));
  }

  // Draw the line chart
  for (int i = 1; i < dataSize; i++) {
    int x1 = map(data[i - 1][0], minX, maxX, 10, SCREEN_WIDTH - 10);
    int y1 = map(data[i - 1][1], minY, maxY, SCREEN_HEIGHT - 10 - 2, 10 - 2);  // Move 2 pixels up
    int x2 = map(data[i][0], minX, maxX, 10, SCREEN_WIDTH - 10);
    int y2 = map(data[i][1], minY, maxY, SCREEN_HEIGHT - 10 - 2, 10 - 2);  // Move 2 pixels up
    display.drawLine(x1, y1, x2, y2, WHITE);
   // delay(500);
  }

  display.display();
}

void buttonInterrupt() {
  if (millis()-buttonPress>200){
  CurrentState++;
  if (CurrentState==3) CurrentState=0;
  buttonPress=millis();
  }
}

void setup() {
  Serial.begin(9600);
  pinMode(buttonPin, INPUT_PULLUP);
  attachInterrupt(digitalPinToInterrupt(buttonPin), buttonInterrupt, FALLING);

  // Initialize the display
  display.begin(SSD1306_SWITCHCAPVCC, 0x3C);
  display.display();
  delay(2000);
  display.clearDisplay();
  display.display();

  // Find minimum and maximum values for scaling


}

void loop() {
  Serial.print("State:");Serial.print(CurrentState);Serial.print( "Reads:");Serial.println(numberOfReads);delay(1000);
  switch  (CurrentState)
  {
  case  0:
    //numberOfReads=0;
    display.clearDisplay();
    display.setTextSize(1);
    display.setCursor(1,1);
    display.setTextColor(WHITE);
    display.print("System Idle");
    display.display();
    break;

    delay(1000);
  case 1:
    if (millis()-readTimestamp>60000 or readTimestamp==0){
      readTimestamp=millis();
      data[numberOfReads][0]=int(readTimestamp/1000);
      data[numberOfReads][1]= int((analogRead(lm35Pin) * 5.0 / 1023.0) * 1000.0);
      numberOfReads++;
      Serial.println(numberOfReads);
      display.clearDisplay();
      display.setTextSize(1);
      display.setCursor(1,1);
      display.setTextColor(WHITE);
      display.println("Reading Temperature");
      display.print("Number of reads: ");
      display.print(numberOfReads);
      display.display();
    }

    break;
  case  2:
     for (int i=0;i<dataSize;i++){Serial.print(data[i][0]);Serial.print("-"); Serial.println(data[i][1]);}
     dataSize = numberOfReads;
     minX = data[0][0];
     maxX = data[dataSize - 1][0];
     minY = maxY = data[0][1];
     for (int i = 1; i < dataSize; i++) {
      int x = data[i][0];
      int y = data[i][1];
      if (x < minX) minX = x;
      if (x > maxX) maxX = x;
      if (y < minY) minY = y;
      if (y > maxY) maxY = y;
    }
    // Draw the line chart
    display.clearDisplay();
    display.display();
    drawLineChart();
    display.display();
    delay(1000);
    break;
  }
}


_3u05Tpwasz.png?auto=compress%2Cformat&w=40&h=40&fit=fillmax&bg=fff&dpr=2)
Comments