


Hardware components | ||||||
| × | 3 | ||||
| × | 3 | ||||
| × | 3 | ||||
 |
| × | 3 | |||
| × | 3 | ||||
 |
| × | 3 | |||
Software apps and online services | ||||||
 |
| |||||
 |
| |||||
Hand tools and fabrication machines | ||||||
 |
| |||||
I wanted a personal project that I could achieve and actually learn something from. While I did learn many things, I unfortunately did over scope, but that is not to say that the project was unfruitful.
My original plan was to deploy 3 sensor nodes around my house and log what was happening in each room. From that, I would use my data and train a model that could determine different pollution events around the house, telling the difference between cooking, cleaning, or even a lit candle. I even wanted to expand this from recognizing the event to acting on it, switching on air purifiers.
However, the project had to be reoriented many times because of constraints from the data, mainly the amount of data I had and the quality of the data
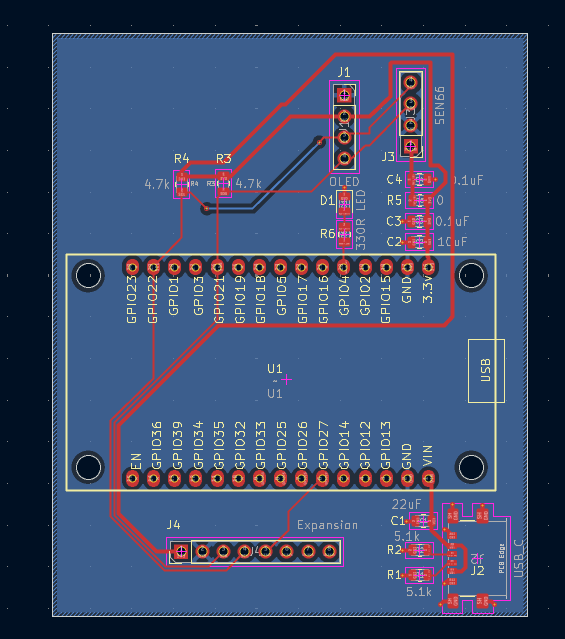
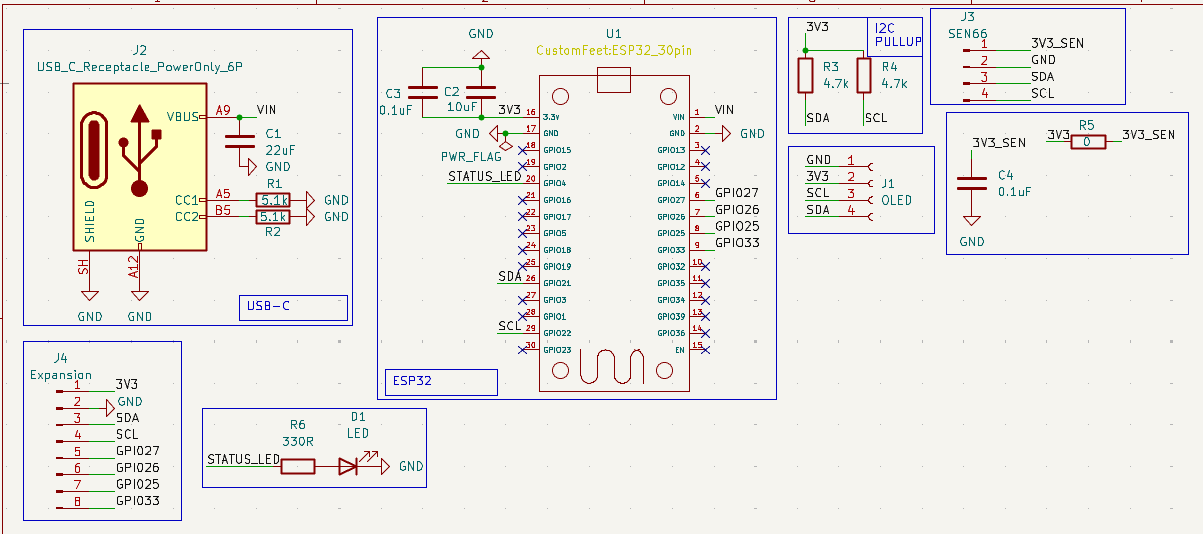
The hardware, which never had to changeEach node is a custom PCB that carries and ESP32, a Sensirion SEN66, and OLED screen, and 8 extra header pins for any additional components to be added later.
The SEN66 gives nine channels from one I²C part: PM1.0, PM2.5, PM4.0, PM10, VOC Index, NOx Index, CO₂ equivalent, temperature, and relative humidity. After assembling three separate modules, I set them all up in the same room to collect data and tracked it to ensure that the deviation between the three sensors was negligible. One thing I had to account for was self-heating from the SEN66 which affected temperature measurements. This was easily accounted for with a temperature-offset applied on-device.
The 3 modules were programmed with some basic code drawing on the example SEN66 sketches on Arduino IDE. Sampling occurs every 5 seconds, with all 3 modules running the same sketch, differing only in NODE_ID and NODE_NAME.
The flow of data is as follows:
SEN66 → ESP32 → WiFi JSON POST → Flask → SQLite → Streamlit dashboard→ analysis
SEN66 → ESP32 → WiFi JSON POST → Flask → SQLite → Streamlit dashboard → analysisEverything runs locally. No cloud service, no third party handling what is effectively a log of when I cook and when my windows are open.
Shortsightedly, I ran the Flask server locally of my computer but after nearly a month of nonstop data collection it impacted my connectivity in video games (yes this was mainly how I noticed the effect) even after attempts to reduce the load it put on my computer (every single measurement used to be logged to Powershell which became a bad idea very quickly). The Streamlit dashboard is also hosted locally, so other devices connected to the home WiFi can access the dashboard. This is the main way I tracked room states and events, relying on accurate updates to the dashboard on the three rooms I was tracking.
First Issue: The classifier had nothing to learn fromThe end goal at first was going to be a four-class source classifier with a channel-ablation experiment. I would determine which of the nine channels actually carry the signal and how much accuracy survives after dropping each one at a time.
However, nearly all the data I had were all cooking events. I had previously planned to be able to identify cooking, cleaning, candles/incense, and occupancy events. Clearly I wouldn't be able to train a classifier on that, and even if you could, you couldn't honestly validate it on the basis of it being able to identify cooking events extremely well.
This is the first time that a theme of errors in data collection shows up through out this project.
What I pivoted to:Since I had many cooking events, I tried taking advantage of this when changing the projects direction. Having a great number of near identical events being tracked in the same rooms led me to refocus the project towards identify airflow transport in the house. I wanted to ask: when pollution happens in any room, how does that air move through the home, how long does it take reach rooms, and how much of the pollution is "cleared" in transit.
The dashboard should've been betterThis was the center piece of data collection and the part I greatly underestimated which ultimately led this project not achieving what I wanted it too. The quality of the data was entirely dependent on the accuracy of the data (obviously) and this mean it was entirely on the humans controlling the dashboard and how truthfully events were recorded. Events and room states should've been recorded exactly at the time they started and ended. However, after missing a few, I added a way to reconstruct events and room states retroactively, which became too much of a crutch and a source of error. Many cooking events were recorded hours after they happened, with faulty event lengths. Room states were also very inconsistent with windows being opened at odd times changing airflow and outside pollution influence.
The dashboard runs on the local network, and whoever is standing in the kitchen logs the event from their phone while the pan is still hot (in theory).
- Live Monitor — per-room online/stale/offline status and all nine channels, so a dead node is caught in minutes rather than at the end of the day
- Event Logging — the labelling interface: start/stop against a source room, per-room toggles for window, exhaust fan, purifier, and AC, plus retroactive entry
- Historical Analysis — long-range trends with hover-to-inspect timestamps
- Room Comparison — two-room overlay, correlation, lag estimation
- Event Analysis — threshold-based episode detection
- Data Export — raw CSV plus the joined labelled dataset
Events are logged once, against their source room only. Room conditions are logged as a change history rather than a snapshot, and the export attaches whatever was active in that room at that moment via an as-of join. Every label records when it was entered alongside when it happened, so retroactively recalled labels stay identifiable.
Measuring transportEach event becomes one row per room:
Metric:
Meaning:
arrival_lag_min
Minutes between the level clearing baseline in the source room and doing so here
xcorr_lag_min
Independent lag estimate from cross-correlation of the whole curve
attenuation
This room's rise ÷ the source room's rise — how much survived the trip
clearance_min
Time from peak to falling halfway back to baseline
snr, detected
Whether the event was measurably present here at all
Next Issue: events were too weak to measureI had eighteen closed events tracking PM2.5. The signal did travel, as it was detected in the living room in 83% of events and in the bedroom 78% of events, with media arrival lags of around 5 minutes in each room.
Analyzing the data showed that weak events scattered this lag across a 19-minute spread, and a third of these pointed backwards in time (air reaching the bedroom before it left the kitchen), which is essentially just signal noise that is interpreted as an event. Stronger events tightened to the median 5-minute spread, and 88% pointed the right way.
Two thirds of my collection was weak events. After a month of tracking, I didn't expect to have a massive comprehensive dataset but at least some usable data. In hindsight, it is pretty clear how I should've trained this. Obviously I should've been more regimented in actual collection, but I should've also had a few large staged events. Here, I could exactly control event starts and stops because I would plan the event, and I could accurately identify them. Adding a lot of these in would probably have helped a lot.
A problem I haven't figured outThe living room very frequently registered a larger PM2.5 rise than the kitchen, with a median attenuation of 1.44, which is physically impossible.
As the pollution from the kitchen diffuses through the house, one would expect there to be less and less particulate matter registered at further ends of the house, but this behavior is the exact opposite. All sensors were tested and calibrated as mentioned earlier to prevent against these types of errors. On top of this, the bedroom behaves somewhat expectedly, with a median attenuation of 0.87.
The living room doesn't have any open windows or any other source that might cause outside air to contribute to a higher particulate matter count like the other rooms, so this issue still stumps me.
Trying to find a question I can answer:At this point, I was nowhere near my original vision for the project. It seemed that much of my data wasn't usable, so I decided to test exactly that. I decided to test two models against each other, both with the intent of answering this question: does knowing what is happening in other rooms help predict this room? The only difference between the two models is that one could only see that room's history, whereas the other could see all rooms.
The winner is decided as such: both models are scored by mean absolute error, which is converted into a "score" against the do-nothing baseline. The goal is to determine change, so doing nothing means predicting 0. A skill of 0 means the model matched doing nothing, 1 is perfect, and negative means the guess was worse. Then, the gap between the the models would show whether air movement carried predictive information, and how large that gap was would hint at how strong the correlation is.
The scoring was carried out in three slices of the data, in an attempt to precent one number from determining the entire result. These three slices were: all the minutes, minutes inside actual logged events, and the top 10% most volatile minutes (greatest change in PM levels).
When scoring, much of the big picture was missed. Even when scoring the logged events, much of the volatile change in pollution was missed, as the three largest pollution episodes were not logged at all, meaning none of these minutes were labeled. At this point it was clear, that data was my biggest bottleneck and I hadn't succeeded in collecting much of any data worth using.
What I did actually learn:I learned that projects probably don't go the way you expect them. I had never really pursued something like this independently, without some blueprint to follow so the entire process was eye opening. Right off the start while designing the PCB I had an eye opening experience into real circuit design. The PCB was nothing like the traditional circuits I learned in my high school classes. I always wondered what the point was learning about capacitors, resistors, inductors, and all the other circuit elements. I knew the equations, their behaviors, and how they influenced a circuits behavior, but I never stopped to consider why I would even used them. This tied back nicely into PCB design where I discovered one use case for many of these components, learning that capacitors are used to supply clean power, as they act as energy reservoirs, helping stabilize fluctuations in current draw. I learned more uses of the resistors, and how they're used in I2C communication.
Actually making the PCB taught me a great deal, such as how important it is to have all the right tools. Missing a single one would mean I couldn't have soldered the board. An on the topic of soldering, I learned that I should probably use larger components next time like 1206s instead of 0805s (while being on the "larger" end, the 0805s were still extremely difficult to solder) or just design with components out of PCB manufacturers specific libraries, so I can just send them my design to be manufactured and assembled by them.
The latter half of this project taught me a great deal about data collection, what not do and what to do as I've already reflected a great deal already, and also a lot about data cleaning and analysis after collecting it. Even though the ML focus of this project ended up being a lot smaller than original intention (as a result of the poor data), I was able to learn a little bit about and get familiar with the basics leading up to the actual data analysis.
Where this goes nextI would definitely want to continue working on the PCB design, this was the part I felt most excited about during the project. I had so much fun watching videos, trying to figure out how to make my schematics, what components I needed, and how to run my traces. Even though it took me an entire week to figure out I couldn't make the design work without a via, it was still extremely enjoyable. I will probably work on making a V2, where everything is integrated onto the board itself. I don't want to be using header pins to be mounting the ESP32 or the SEN66. I noticed when deploying that the SEN66 was prone to flipping over (sensors face down to the floor) because it was connected to the PCB through the header, and the PCB was dangling in the air (the USBs were extremely short and the PCB just drooped below the power outlet). I don't think this is an over scope, and I would probably outsource the assembly to a PCB manufacturer so I can use smaller components and can forgo the assembly process (as fun as it was, it was extremely time consuming).
In terms of collecting data and analyzing it, I'm not 100% sure, but some improvements I would make if I do continue:
- I would remain much more disciplined, logging everything as truthfully as I can.
- I would stage events, and even "pair" them, maybe making the same dish, in the same environment with one factor changed (AC, exhaust, windows open/closed, etc).
There are definitely many more improvements that could be made. Below are a few images of the dashboard and the PCB:


Comments