


Hardware components | ||||||
| × | 1 | ||||
| × | 1 | ||||
| × | 1 | ||||
| × | 1 | ||||
| × | 1 | ||||
| × | 1 | ||||
| × | 2 | ||||
| × | 1 | ||||
| × | 1 | ||||
| × | 1 | ||||
| × | 1 | ||||
| × | 1 | ||||
| × | 1 | ||||
| × | 1 | ||||
 |
| × | 1 | |||
| × | 1 | ||||
 |
| × | 1 | |||
| × | 1 | ||||
| × | 1 | ||||
| × | 2 | ||||
| × | 1 | ||||
| × | 1 | ||||
Software apps and online services | ||||||
| ||||||
| ||||||
| ||||||
 |
| |||||
| ||||||
Hand tools and fabrication machines | ||||||
 |
| |||||
 |
| |||||
Using this setup, 60 different stimulants were released into the air as vapor diffused from 32 essential oils from an aroma diffuser and 27 boiled herbs/spices from a water heater. The water heater, aroma diffuser, and air purifier are all controlled automatically via LabVIEW. Precise timing was crucial for the operation of the whole system.
The main article is published in a prestigious journal, ACS Omega, and although it contains a detailed explanation of the results, the vast technical details could not be well discussed due to page limitations.
So, in this post, as a first author, I will write in detail about my 3-year experience, along with all the resources (software/hardware) I created, so that anyone can use and start researching on their own! let's dive into it!
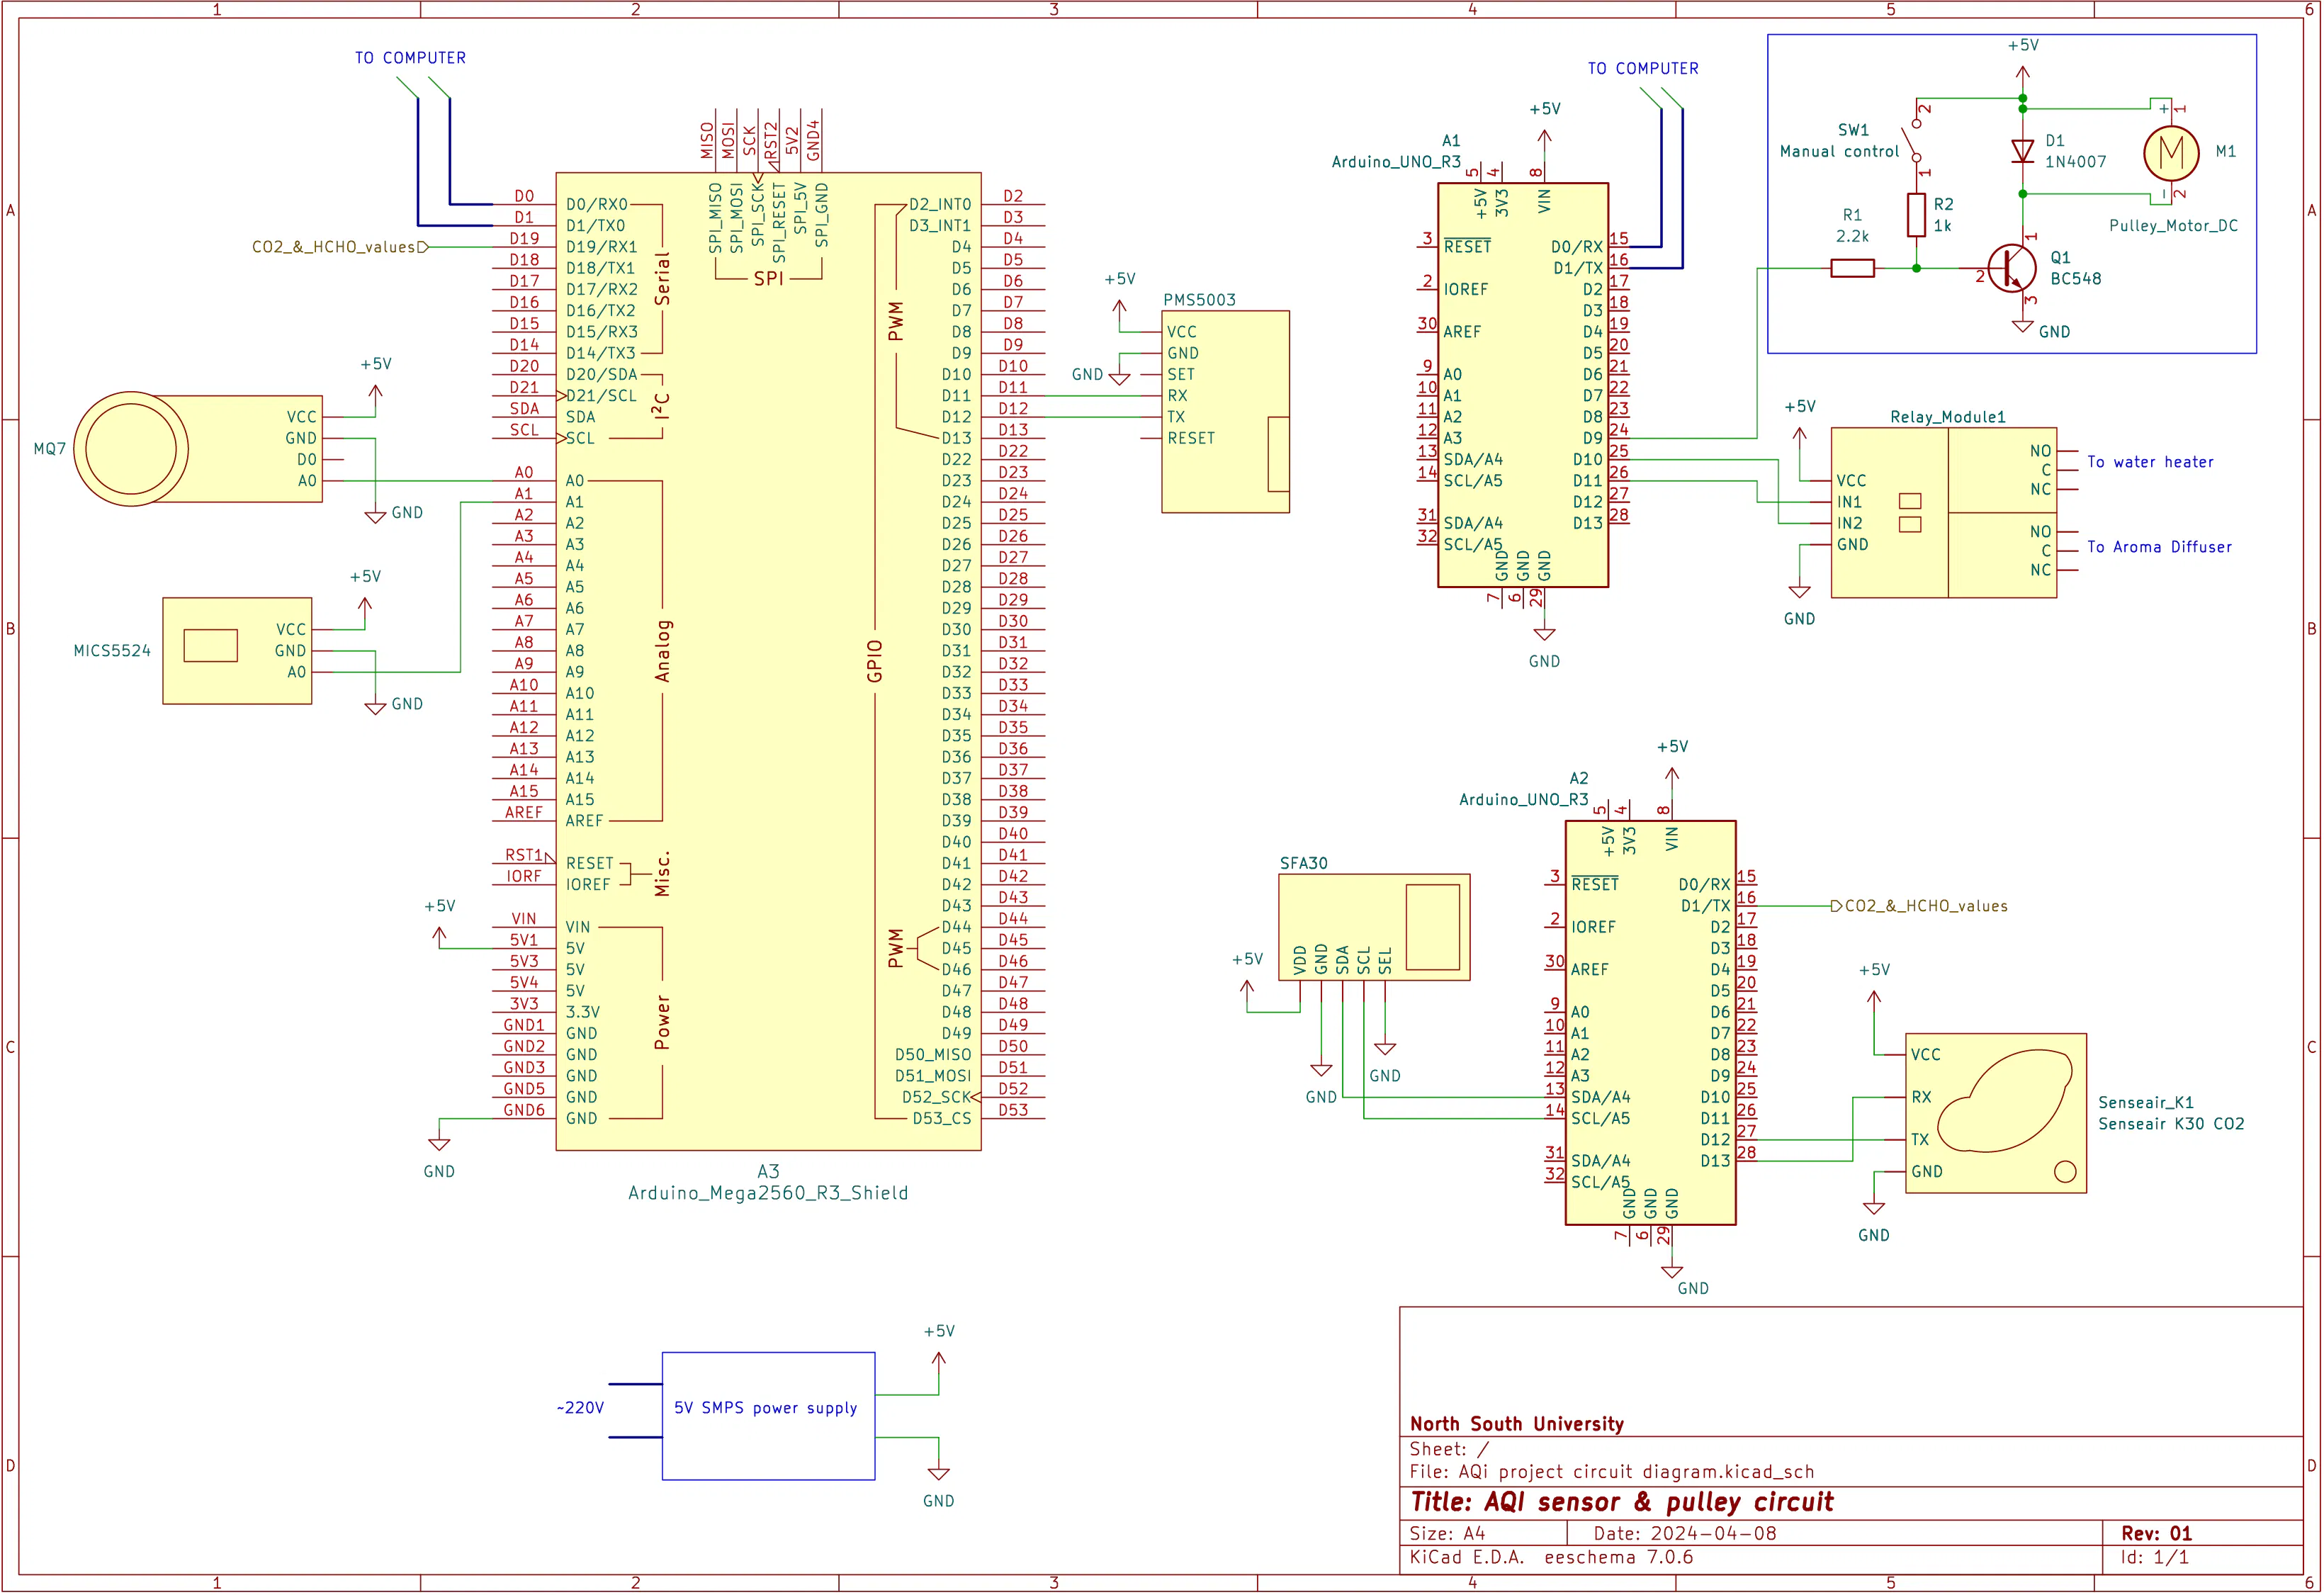
The main sensing circuitry is pretty straightforward. One Arduino Uno (1) receives data from K30FR (CO2) and SFA30 (formaldehyde) sensors via I2C and UART. It then processes and sends data over UART to the Arduino Mega. It is not connected to the computer via USB.
The Arduino Mega receives these data analog signals from the MQ7 (CO) and MICS5524 (TVOC) sensor and serially communicates with PMS5003 (particulate matter) sensors. Additionally, it waits for the Arduino Uno (1) to send its data.
Finally, it creates a string with all the sensor data and sends it via USB to the computer running LabVIEW.
An Additional Arduino Uno (2) is used to signal an N20 motor and 2 Relays to control the water heater lid and power the heater and aroma diffuser, respectively. (Check the following steps)
Sensor circuit connections:Arduino Uno(1) ---> Arduino Mega
D1(TX) ---> D19(RX1)
GND ---> GND
Arduino Uno(1) ---> SFA30
A4(SDA) ---> SDA
A5(SCL) ---> SCL
5V ---> 5V
GND ---> GND
Arduino Uno(1) --->K30FR
D12 --->TX
D13 ---> RX
5V ---> 5V
GND ---> GND
Arduino Mega ---> MQ7
A0 ---> A0
5V ---> VCC
GND ---> GND
Arduino Mega ---> MICS5524
A0 ---> A1
5V ---> VCC
GND ---> GND
Arduino Mega ---> PMS5503
D11 ---> RX
D12---> TX
VCC ---> 5V
GND ---> GND
Note: I should've used an upgraded microcontroller, such as the Teensy board, instead of Arduino, since Arduino has only a 10-bit ADC and thus the analog input is less accurate. However, we focused on qualitative change rather than on quantitative, so it was enough.
Building the Mechanical Lid OpenerI wanted to keep the setup completely autonomous, which also includes the introduction of ingredients during a running experiment. So, I built a pulley system using an N20 100RPM motor. A thin nylon string is wrapped around its shaft. The string & the motor are so strong that they can pull the water heater body with ease.
The Frame structure is made using a 5mm PVC sheet cut using an anti-cutter.
Additionally, I made a transistor (BC548) based motor controller to control the motor via LabVIEW directly. LabVIEW sends a signal to this transistor via an Arduino Uno. A flyback diode (1N4007) is used to keep the transistor safe from the backward voltage from the motor.
The motor stays ON for about 4 seconds on each pull, which is enough to completely open the lid.
Building the OCR SetupThis is one of the crucial parts of this project. We had a commercially available meter that could show the constituents of PM2.5, HCHO, TVOC, CO2, Temperature, and humidity.
But it had no method of data acquisition. These meters are quite expensive, and the funding would not allow the purchase of another meter. So, we opted to use computer vision and collect data using MATLAB.
Initially, I used my phone to take a live video of the meter and feed it to MATLAB. After fine-tuning, I was able to take a data sample at 1Hz and save it in an array. See the first video. You can find more details on my other Instructable post.
But using a phone was not practical, and we quickly realized that regular web cameras cannot focus on close objects; two lenses were used with careful calibration to focus the image on the camera lens.
Controlling the Heater & Diffuser RemotelyFor full autonomous control, I needed to turn on the water heater or the aroma diffuser after a particular period of data acquisition under undisturbed conditions. Precisely, 22.5 minutes. I cannot just go inside the room and turn on the heater while the experiment is running.
So, by using two relays and an Arduino, I was able to turn on the heater directly from LabVIEW. I had to, obviously, tinker with the switches of the diffuser and heater. The relays just close the ON switch of these apparatuses when signaled from LabVIEW. The relays also work to switch off the apparatuses.
Servo Motor Setup to Remotely Turn on Air PurifierWe also conducted an experiment with an air purifier. I was not allowed to sabotage the air purifier's circuitry, so I used the simplest possible method to turn the purifier on remotely.
Using an MG90S servo motor combined with a 315MHz remote receiver, I can turn ON/OFF the air purifier directly from another room. Use LORA modules instead of 315MHz, because it is better and unique address can be added.
This system is temporarily built on a breadboard and powered by a power bank for that specific experiment. When the Arduino Pro Micro receives a digital HIGH signal from the remote transceiver, it rotates the servo motor to a particular angle, which presses on the ON/OFF button of the apparatus, turning it on.
The results of this experiment were phenomenal.
The DashboardThe Main dashboard is made using LabVIEW 2021. The heart of this project is the LabVIEW software. According to NI, "LabVIEW is systems engineering software for applications that require testing, measurement, and control with rapid access to hardware and data insights". It shows the live data along with creating an Excel file to store that data.
You can get the installation file for LabVIEW from getintopc.com
It features:
- Selecting available COM ports for Arduino, Cameras, and MATLAB
- Number of samples, time delays, and timeouts.
- Excel output file directory selection with file name.
- Visual representation of real-life AQI parameters.
- Live Web camera feed for remote observation.
- Buttons for manually controlling heaters and the pulley.
Steps to start the experiment:
- Run the MATLAB image recognition code on a virtual port. (check below)
- Before running the LabVIEW VI, select the appropriate COM ports and camera port from drop down option.
- Enter the number of samples to be recorded for the experiment.
- Set the directory for the export file and write a name with .xls at the end.
- Finally, run the VI using the run arrow button.
- The system automatically takes over from here.
The Backend has been developed over 2 years! Started with basic data acquisition, it can now automatically run the whole experiment from start to end without many errors. It may look complicated, but it is actually divided into several sections that work almost independently.
How each section works:
- Loop: It basically initializes serial communication with the Arduino Mega and MATLAB. It simply receives a string of data, separates the numbers using a 'space' delimiter, and sorts them into separate numbers. These numbers are fed into a spreadsheet and viewed using several 'waveform graphs'.
- Data save and counter: This section creates a spreadsheet in the designated directory with data collected from the 'Loop' & 'Date and time loop' sections. This section also keeps track of the time of all the processes, which includes sample placement initialization, experiment time remaining, and stopping the experiment.
- Sample place loop: The section uses the LINX package of LabVIEW to control the Arduino Uno (2). This includes the turning ON/OFF of the water heater & aroma diffuser, signaling the N20 motor to pull the lid. The 'Sequence override' button can be used to override the process.
- Webcam loop: This loop initializes communication with the USB camera and shows live footage using the 'webcam live' block.
- Date and time loop: This section only picks the current date and time from my computer and shows it on the frontend. This data is also fed into the "Data save and counter" section via a global variable.
- Indicators: Contains some indicator blocks (LEDs) on the frontend, which light up if all the connections are successful.
- Warmup timer and auto acquisition starter: as the name suggests, this uses a pre-made subVI to convert the sample number into hour, min and seconds. The subVI also signals 'DAQ start" to start the N20 motor and water heater after the 675th sample.
I found an easier way to communicate between these two tough software! Serial communication. What it basically does is:
- A Virtual Serial Port Emulator software is used to create a "Virtual pair" of serial ports using COM21 and COM20 ports.
- Matlab connects to the virtual port (COM21) & sends its data to this port at a 9600 baud rate.
- LaVIEW connects to the other virtual port (COM20) and waits to receive data.
- Since these two ports are 'virtually connected', it creates a tunnel for data to pass from MATLAB to LabVIEW.
And that's how easy it is to transfer data between two stubborn software.
Connecting and Powering EverythingAt this point, the setup is ready to run. For a wired connection between my room and the experiment room, I had to literally drill a hole in the wall. Only a USB-A extender cable connects the setup to the computer.
Preparing Remedies Before Running ExperimentsAs the experiment is completely autonomous, I had to prepare the herbs & aroma oils beforehand. This is one of the crucial parts, since a new experiment requires the container to be free of previous chemicals.
The remedies are placed in cold water before starting each experiment and kept shut using a lid. The lid is later mechanically removed using a motor, followed by turning the water heater/aroma diffuser ON for the remedies to diffuse in the room.
Few Snippets During ExperimentsFinally, it's time to analyze data and draw a conclusion.
LabVIEW creates a blank Excel file at the start of the experiment, and throughout the time, it writes data onto the Excel file. See the second picture.
The data are arranged in 17 columns:
- Date,
- Time,
- PM2.5 (from meter),
- HCHO (from meter),
- TVOC (from meter),
- Temperature (from meter),
- Humidity (from meter),
- CO2 (from meter),
- PM1.0 (from sensor),
- PM2.5 (from sensor),
- PM10.0 (from sensor),
- CO (from sensor),
- TVOC (from sensor),
- HCHO (from sensor),
- Humidity (from sensor),
- Temperature (from sensor),
- and CO2 (from sensor).
We used OriginPro to generate the graphs from the data. My co-author helped me greatly sort the graphs with all the unit conversions, trends, comparisons, and create the final diagram as shown in the picture above.
Our study helped determine the effectiveness of the 10 best out of the 60 herbs that can purify air to various extents. The chemistry behind this change has also been analyzed and included in the picture.
I hope these instructions and resources were helpful, and I hope to see more people use these resources and write a paper of their own! Cheers!


Comments