


Hardware components | ||||||
 |
| × | 1 | |||
| × | 1 | ||||
Software apps and online services | ||||||
 |
| |||||
 |
| |||||
 |
| |||||
Hand tools and fabrication machines | ||||||
| ||||||
| ||||||
| ||||||
| ||||||
| ||||||
| ||||||
Rotating machinery parts are ubiquitous components in equipment ranging from laptops to industrial plants. Failure of such a key component can lead to reduced efficiency, curtailed operations, and even shutdown. Operators use scheduled maintenance today to catch potential failures before they occur. Scheduled maintenance plans are static and agnostic of the actual operating condition of the machine. Condition-based maintenance can help operators be more proactive with maintenance and help optimize scheduling of the maintenance. Consider the example of fans in ducts in a mine that transports hazardous gasses out of the mine. Wouldn't it be nice if the fans themselves become intelligent to call the maintenance team before the need arises?
In this example, we demonstrate the use of an inexpensive 3-axis accelerometer attached to an industrial duct fan to collect vibration data, analyze the data as the fan is in operation to predict when the fan might fail and send email notifications for maintenance. Here is a video introduction to the project.
Some typical failure modes in the case of a fan or pump are when it is unable to move the fluid, in this case air, effectively. While there may be many reasons, two of the most common are that the duct is partially or completely blocked or that the blades of the fan are covered with dust, thereby reducing its effectiveness in moving fluid. We simulate these two failure modes on the duct fan, collect the data to build a model of the fan, and apply the model to predict failure when the fan is in operation. The data is collected using Thing Speak. Data processing, feature extraction and training of Machine Learning and Predictive Maintenance models are performed offline using MATLAB tools. The same code used for offline training, and the trained model, are uploaded to the cloud and used to predict the condition of the fan using MATLAB Analysis on ThingSpeak. This system's design is as shown below.
Create a new ThingSpeak Channel with six active fields and name the fields: X1, Y1, Z1, X2, Y2 and Z2. Note the write API, read API keys and channel ID this channel in the API keys tab of your channel view. The output data rate of the 3-axis accelerometer in the Internet Button is 100 Hz. For this project, we use the ability to update our ThingSpeak channel once per second. 100 raw vibration sensor readings/second per x, y and z axis are uploaded to the ThingSpeak channel. The data is compressed into two CSV data fields for each axis. Hence, we need six active fields for the three axes.
If you have not used the Particle photon before click here to learn how to setup and use the device. The Internet Button code for data collection is present in HealthMonitor.ino.
1. Fill in the myWriteAPIKey and myChannelID variables and flash the code onto the device.
2. Attach the Internet Button and a power bank to the duct fan using Velcro.
3. Follow the procedure given in the Appendix to collect about 2000 data points from two experiments.
Rename the two data files as Dataset1.csv and Dataset2.csv respectively and place them in the folder named "Datasets" under the current working directory of MATLAB on your computer.
Open the Training.m file in MATLAB. The labelPoints variable is an array that holds the index value where the experimental data changes from one fan state to another for two experiments. Change the labelPoints variable to the data index which the transition between the three states of your experiment took place.
labelPoints = {[252,501],[251,500]};
For example, if labelPoints has the above value, then dataParsing() labels the first 252 points in experiment 1 as OFF, points indexed 253-501 as ON, and so on. The dataParsing() function parses the six string fields of ThingSpeak, decodes the 100 raw sensor readings every second and labels each sample point based on your labels and labelPoints arguments. Run the first two sections of the MATLAB script to visualize and explore the collected sensor data in time and frequency domains as shown below.
From the above graphics, we canobserve the following:
- The variance of the data in the time domain increases as the fan is turned ON and as the failure develops in both experiments.
- In the frequency domain for the experiment 1 data, the peak shifts from 30 Hz to 25 Hz in experiment 1.
- In experiment 2, the peak in the frequency domain remains at the same point but the amplitude at that frequency increases.
Run the next section of Training.m to plot the features that are extracted using extractFeatures().
Next, we will train a machine learning model using the features that were extracted from the raw vibration data to classify the fan’s four states. The following section uses the functionality from Statistics and Machine Learning Toolbox.
1. Enter classificationLearner on the MATLAB command prompt to open the MATLAB Classification Learner App.
2. Click the New Session button on the top left corner of the app and select combinedFeaturesworkspace variable with Label as the Response.
3. Select the Predictors that showed some trend in the previous section.
4. Increase the Cross-Validationfolds to 10 and click Start Session.
5. Select All available classifier types from the tool-strip and click Train.
6. After the training is completed, select the classifier with the highest test accuracy in the Data Browser.
7. Now click Export Model from the tool-strip as a workspace variable named trainedModel.
8. Run the following the command to save the model in your working directory.
save('Fan Diagonizer Model.mat','trainedModel','labels');
In this project, we build a prototype model which can be extended for real-world models given the availability of failure data. Once a fan has been diagnosed for one of the two failures modes, we want to know how long the fan can run before it needs service. We call this time the Time to Service (TTS) of the machine. The TTS can be effectively determined using MATLAB's Predictive Maintenance Toolbox. Typically, one needs a complete failure history of a machine to estimate TTS of similar machines. The complete failure data can take a longtime to collect depending on the machine you are modeling.
We define failure of the duct fan as complete blockage of its airflow or when the blademassimbalance or rotor imbalance is maximum. The data during off state of the fan is not used in this part of the analysis.
1. From the extracted features for each failure modes, select the most trending and monotonic features and fuse them as a single health indicator using principle component analysis.
2. Enter the name of the selected features in the Training.m in the Synthesize Health Indicator section. In the example below, we chose FreqX and FreqY for experiment 1 and StdZ for experiment 2.
selectedFeatures{1,:} = {'FreqX','FreqY'};
selectedFeatures{2,:} = {'StdZ'};
Predictive Maintenance Toolbox includes several Remaining Useful Time (RUL) estimation models. We are interested in the degradation models: exponentialDegradationModel and linearDegradationModel. Since the data collection process and the health indicator resemble more of a linear process than an exponential, we choose linearDegradationModel for this project.
3. Now, run the Build and Fit RULModel section of Training.m to fit and test the linearDegradationModel. The models and the associated variables are stored in Fan TTS Model.mat in the working directory.
We will set up the several other apps that are required to complete this project. Open Analysis.m file in MATLAB. You will be filling the following variables in this part: dropBoxAccessToken, IFTTTURL, deviceID, deviceAccessToken.
DropBox App: To use these trained models on ThingSpeak, we will need acloud storage facility. We use the Dropbox API for this purpose. Generate a DropBoxaccess token by following the steps.
1. Go to www.dropbox.com/developers/apps in a web browser
2. Click on "Create app"
3. Select "Dropbox API" and "App folder" for options (1) and (2)
4. Specify the name of the folder you want your files to show up in
5. Click on the "Generate Access Token" on the page
6. Use this access token to fill in dropBoxAccessToken variable
Now upload the files Fan TTS Model.mat and Fan Diagonizer Model.mat to this DropBox App folder.
IFTTT Service: This service is used to send email notifications formaintenance through ThingSpeak when the TTS of the fan reaches a minimum threshold. Create an IFTTT applet as shown here with the trigger name "Alert" and use your IFTTT URL to fill in IFTTTURL variable.
Internet Button: Generate the access token of your device, which can be seen in Settings menu of the particle build web IDE and use this to fill in deviceAccessToken variable. To fill in deviceID variable, click Devices menu, expand the details of your device by clicking > that follows your device name to see Device ID.
Create Monitoring Channel
1. Create another ThingSpeak channel with six active fields. Name the fields Vibration Data, Estimated TTS, Fan Condition, Health Indicator, Threshold, and Email Alert Flag. The Email Alert Flag is used to avoid sending multiple maintenance notifications.
2. Use the Channel ID, read and write API keys of this channel to fill in secondChID, secondReadAPIKey and secondWriteAPIKey variables respectively in Analysis.m.
Create Analysis App
The main code to process the real-time data and predict the fan's condition will be written on MATLABAnalysis app in ThingSpeak. The code that goes here is present in Analysis.m.
1. Fill in the variables firstChID and firstReadAPIKey using the first channel details you collected in Part 1.
2. Create a new MATLAB Analysis app on ThingSpeak, paste Analysis.m code.
3. Click Save and Run to check if the code runs without any errors.
Create React App
The last step of this project is to give life to this monitor by creating a React app that runs on every DataInsertion.
1. Navigate to the React app and create a New React.
2. Select the condition type to Numeric,
3. Set the condition to field 1 (X1)is not equal to-10000000
4. Set the action to MATLAB Analysis and code to execute the name of your analysis app.
Select Run action each time condition to meet.
To visualize the health of the device more intuitively, we can take advantage of custom plugin templates on ThingSpeak.
Health Indicator Threshold Plot: We can plot the Health Indicator and failure threshold on the same plot using Chat with Multiple Series template. Create a new Plugin app on ThingSpeak and choose Chart with Multiple Series template. Modify the variables in Javascript code as show below.
 // variables for the first series
 var series_1_channel_id = 123456; //FILL IN SECOND CHANNEL'S ID
 var series_1_field_number = 5; //Ensure that the field number for Threshold is right
 var series_1_read_api_key = 'XXXXXXXXXXXXXXXX'; //FILL IN SECOND CHANNEL'S READ API
 var series_1_results = 22; //No. of sample points
 var series_1_color = '#d62020'; //Red color
 // variables for the second series
 var series_2_channel_id = 123456; //FILL IN SECOND CHANNEL'S ID
 var series_2_field_number = 4; //Ensure that field number Health Indicator is right
 var series_2_read_api_key = 'XXXXXXXXXXXXXXXX'; //FILL IN SECOND CHANNEL'S READ API
 var series_2_results = 22; //No. of sample points
 var series_2_color = '#00aaff'; //Blue color
 // chart title
 var chart_title = 'Health Indicator (blue) and Threshold (red)';
 // y axis title
 var y_axis_title = 'Values';
Health Gauge: Create a new Plugin app on ThingSpeak and choose GoogleGauge template. Paste the code from Gauge.js in the Javascript section of the Plugin. Also, fill-in the channel_id and api_key of the second channel.
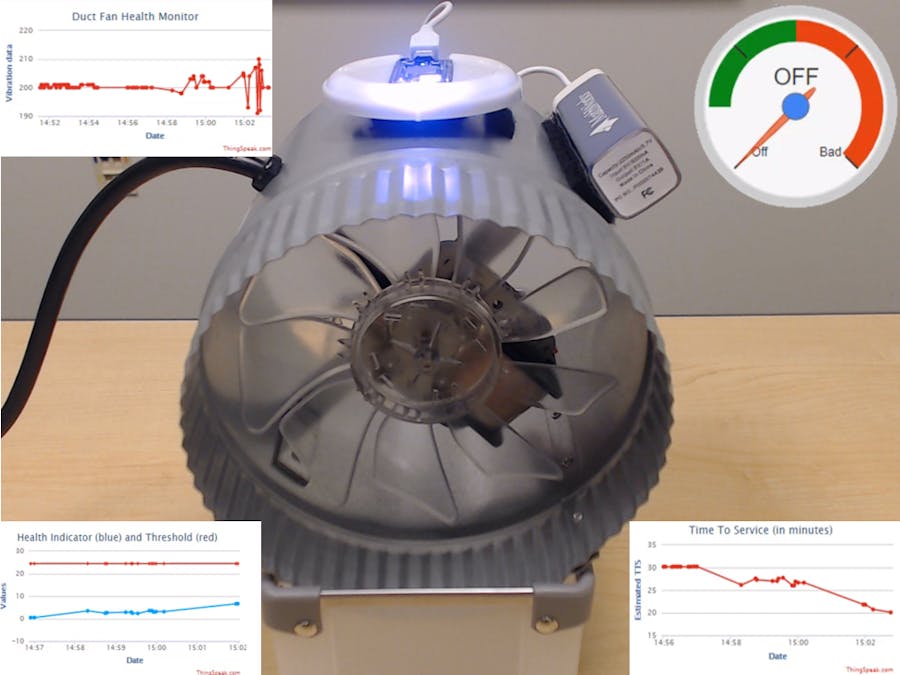
Don't forget to change the display settings to view these gauges on the second channel. Here is a sample of the completed Health Monitor Channel.
Now, you can turn the Internet Button and the fan ON to test the system you have built!
AppendixThe goal of the two experiments is to collect equal amount of vibration data (500 data points) for each of the fan’s four states: OFF, ON, DUCT BLOCKAGE, ROTOR IMBALANCE. The paid license of ThingSpeak provides the ability to update channels once per second and thus enabling us to complete each experiment in 50 minutes.
Note: It is important that the experimental setup remain relatively unchanged throughout the two experiments. This includes ensuring that the fan is mounted on a stable fixed platform and the device is in the same orientation with respect to the fan for the both experiments.
Experiment 1: Simulating failure due to blocking the airflow (1000 data points)
1000 data points = 250 – OFF, 250 –ON, 500 – DUCT BLOCKAGE
- Use a cardboard sheet large enough to cover the entire fan. Divide the cardboard into four equal sections and label them using a marker. Mount the cardboard on a vise and adjust the height such that the cardboard can moved in front of the duct fan as show in the picture.
- Power the Internet Button using the power bank and collect the data for about 12 minutes with this arrangement while the fan is off. After this, note the number of points collected. The number of data points collected can be seen in Entries field under ChannelStats of your channel. You would have collected around 250 points.
- Now, turn the fan On and collect data for 12 minutes and note down the total number of points collected, which will be around 500. Move the cardboard over the fan to block quarter of the airflow and collect data for 6 minutes. Similarly, collect data for 6 minutes each while blocking the half, three-quarters, and complete airflow of the fan.
- Download the data collected from ThingSpeak using Data Export or by entering the following in your web browser after filling your channel id and read API key replacing “<yourchannelID>” and “<your_READ_API_key>”
https://api.thingspeak.com/channels/<yourchannelID>/feeds.csv?api_key=<your_READAPI_key>&results=3000
Experiment 2: Simulating failure due to rotor imbalance (1000 data points)
1000 data points = 250 – OFF, 250 –ON, 500 – DUCT BLOCKAGE
Ways of simulating this failure can differ between different types of fans. For this example, you will collect four different levels of mass accumulation which "progressively" degrades the fan. Our duct fan has nine blades, so we simulate the four levels of this failure by sticking duct tapes of equal mass on four adjacent blades as shown in the picture below.
- Collect data for 12 minutes each in Off and On state of the fan again as in Experiment 1 and note the number of points collected at the end of both states.
- Power off the Internet Button and then the fan. Stick one set of pieces of tape on one of the blades and turn the device and the fan on. Collect data for 6 minutes with this set up.
- Repeat the previous step to collect data for the remaining three levels.
- Download the data.


Comments