

Hardware components | ||||||
| × | 1 | ||||
| × | 1 | ||||
Software apps and online services | ||||||
 |
| |||||
 |
| |||||
 |
| |||||
| ||||||
 |
| |||||
 |
| |||||
| ||||||
| ||||||
Storage has a huge bearing on the final quality of agricultural commodities, and with crops being stored for long periods, losses can occur without close monitoring and attention. Maintaining conditions such as a stable temperature and humidity are vital for preserving the quality of agricultural commodities, whether they be in farm storage, shipping vessel, or vehicle trailer. In global supply chains, commodities may travel across land, sea, and air, being stored in containers for days and weeks before processing or re-sale. If unchecked, conditions in-store can change rapidly leading to losses of quality and shelf life and falling foul of retail and regulatory requirements. As a grower, packer or processor of agricultural raw material, remote monitoring can play a vital role in helping reduce waste, quality losses, and deterioration.
SolutionGreenolo's crop storage and logistics solution is a bespoke managed service that allows growers and the extended supply chain to remotely monitor commodities in storage and make interventions to reduce losses and manage the supply chain. Utilizing the Helium network, your commodities can be monitored in real-time, whether they are in a plastic silobag, grain elevator, at the bottom of a ship, on a plane or truck. Depending on the specific commodity, typical measurements include temperature, humidity and CO2. The data is transferred via Long Range Wide Area Network (LoRaWAN) and a customized dashboard is provided to give you complete visualization of your crop and supply chain, with real-time alerts of changes in storage conditions which could lead to a losses. You gain a complete record of traceability through your commodity’s journey.
This solution caters to the following target market:
- Growers who want to manage storage conditions more precisely to increase marketable yield and quality.
- Purchasers of agricultural raw materials, or people who control a supply chain and want to increase quality and shelf life through more precise management of storage conditions on-farm and in transit.
- Operation of a global multi-model agricultural supply chain transporting agricultural commodities and perishable goods and want to satisfy retail and regulatory requirements
and it's benefits include the following:
- Increase marketable yield – monitor storage conditions in real-time and respond quickly to keep commodities in optimal condition
- Enhance visibility and compliance – understand more about your supply chain and share data to confirm product provenance and comply with regulatory guidance
- Reduce complexity – ensure data and systems are interoperable which reduces the need for manual processes
To successfully build an IoT asset management system, the following components must be thought of first:
Tracking Devices - The form factor varies depending on the use case and the object that needs to be tracked. Here we'll be using Hardshare's Hardware as a Service that utilizes an ST Micro B-L072Z-LRWAN1 Discovery board connected to an ST X-NUCLEO-IKS01A3 sensor board. As, there was no Helium coverage currently in my country, having the HardShare service for use was a Godsend. This service allows you to remotely access the board connected to the Helium Network, is already configured with a working toolchain, and is available from anywhere on the planet.
Connectivity - How are those devices connected? We'll be using the Helium Network which is the world's first peer-to-peer wireless network that provides a secure and cost-effective way for low-power Internet of Things devices to send data to and from the Internet. This network enables companies to focus on applications and use cases, and to not worry about cellular plans for devices or managing network infrastructure. The picture below shows packets containing the payload from this project being sent and received in the Helium Network. You can view this on the Helium Console.
Management Platform - We'll also need a way to remotely manage connectivity, monitor device locations, and access device analytics. We'll be using Amazon Web Services which offers reliable, scalable, and inexpensive cloud computing services. We'll be primarily using their AWS IoT Core service in this project. With the Dashboard built on AWS Amplify that allows us easy access towards services such as AWS DynamoDB and AWS SNS used in the project. Here's the front-end end result of the project.
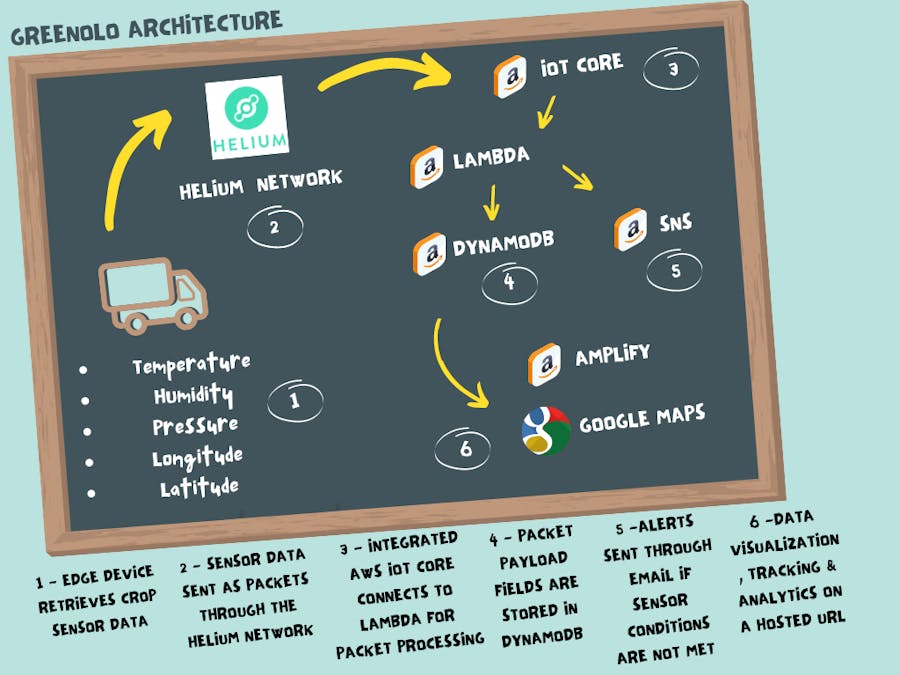
After deciding on the components used in the project, here's a diagram depicting what we'd like to achieve and how it all works together using the components we've selected.
Edge Devices, Sensors & Helium Network
First, the edge MCU is to be retrofitted to the transport mechanism for the crops. Environmental sensor data regarding the crops transported such as temperature, humidity, and pressure is to be obtained from it and is sent as a packet through the Helium Network.
Amazon Web Services
The data coming from AWS IoT Core is passed through the AWS Lambda function which decodes the packet payload and then routes the packet payload containing several fields of the environmental data to their respective columns on AWS DynamoDB. The data stored is then visually displayed on the Dashboard using the AWS Amplify Framework integrated with Google MapsAPI for real-time tracking and analytics.
Simultaneously, in the Lambda Function, the data is routed through AWS SNS where a message is sent to an authorized person via email through this service. So say, you'd like to get notified when the internal temperature during the transportation of crops is above 30 degrees for a certain time, then you can be alerted real-time and can appropriately take action to prevent losses from happening due to crop damage. Or if the transport mechanism falls out of the recommended route, you'd be notified real-time to ensure that logistics goes as planned.
DemoHere's a quick demonstration on Greenolo.
DevelopStep 1 - Setup Helium Network integration with Hardshare's Discovery board
- Create a Helium account here.
- Once logged in the Helium console, create a new device, and give it a name as shown below:
- Obtain your device's APPEUI, DEVEUI, and APPKEY values after the new device have been created. Change these values to the format (MSB or LSB) listed below. These are used to connect and verify the discovery board to the Helium Network.
- Request a remote session using Hardshare here. Currently, there is a limit of 15 minutes per session. You'll be presented with the following screen, where you'll be able to build and flash code remotely on the discovery board.
Copy your device's APPEUI, DEVEUI, and APPKEY values obtained earlier in the following fields.
HardShare's service provides a code template that interfaces the sensor data such as acceleration, angular velocity, pressure, humidity, and temperature with that template as follows:
// Read humidity and temperature.
    float humidity = 0;
    float temperature = 0;
    HumTemp->GetHumidity(&humidity);
    HumTemp->GetTemperature(&temperature);

    // Read pressure and temperature.
    float pressure = 0;
    PressTemp->GetPressure(&pressure);

    // Read accelerometer and gyroscope.
    int32_t accelerometer[3];
    int32_t gyroscope[3];
    AccGyr->Get_X_Axes(accelerometer);
    AccGyr->Get_G_Axes(gyroscope);
Moreover, it uses the Cayenne packet format which is a well-optimized way to send sensor data over low bit rate connection, like LoRa but requires a deep understanding of its format to decode the packet. So for the purpose of simplicity we'll change this part of the template:
// Pack Packload
lpp.addTemperature(1, temperature);
lpp.addRelativeHumidity(2, humidity);
lpp.addBarometricPressure(3, pressure);
lpp.addAccelerometer(4, accelerometer[0], accelerometer[1], accelerometer[2]);
lpp.addGyrometer(5, gyroscope[0], gyroscope[1], gyroscope[2]);

//send payload
LMIC_setTxData2(1, lpp.getBuffer(), lpp.getSize(), 0);
To this:
static uint8_t dataArr[9] = {0};
dataArr[0]=temperature;
dataArr[1]=humidity;
dataArr[2]=pressure;
dataArr[3]=accelerometer[0];
dataArr[4]= accelerometer[1];
dataArr[5]=accelerometer[2];
dataArr[6]=gyroscope[0];
dataArr[7]=gyroscope[1];
dataArr[8]=gyroscope[2];

//send payload
LMIC_setTxData2(1, dataArr, sizeof(dataArr), 0);
Once, the code is built and flashed to the microcontroller, verify that the setup and connections are working by looking at the event logs in the Helium Console. The.C file is included as an attachment with this guide for your reference and shown below, you'll see that packets are being sent and received through the Helium Network.
Step 2 - Setup AWS IoT Integration with Helium
Helium has excellent documentation regarding AWS IoT integration here. Alternatively, you can view how to set this up with the following video by Helium:
Once you've successfully integrated AWS IoT Core with Helium, you should be able to see the Integration as packets are sent to the Helium Network.
To further verify that the integration is successful, we can test it using the AWS MQTT Client subscribed to the MQTT topic as shown below. We see that the packet sent to the Helium Network received by AWS IoT contains several fields. The sensor data is encoded in the payload field (seconds picture below) in which we'll decode later on.
Step 3 - Decode packet payloadand save to DynamoDB using AWS Lambda function
We first decode the packet payload containing the sensor values using theAWS Lambda function. This function is automatically triggered whenever a packet has been sent to AWS IoT core via the Helium Network
First, create an IoT Rule in the AWS IoT Core console and specify the topic in which the Lambda function is triggered when data is sent to that topic.
Then select the "Send a message to a Lambda function" as the action whenever the IoT rule is triggered.
Code up the function in Python such as follows. Here we'll be decoding and then storing the payload data in a DynamoDB table to be used by the Amplify Dashboard later on.
After coding the Lambda function, all that's left is to create the IoT rule and we're presented with this.
You can check whether the payload data is being routed to DynamoDB by visiting the Table you specified in the Lambda function. Here we've received some packets over time. Note: You'll need to create this Table yourself on the DynamoDB console.
Step 3 - Building Dashboard with AWS Amplify
For reference, here's the full code repository, if you'd like to follow this section step by step.
Tools Required
- NodeJS - a JavaScript runtime built on Chrome's V8 JavaScript engine.
- NPM- the default package manager for the JavaScript programming to install the required modules in our system.
- React - a JavaScript library for building user interfaces
- Material-UI- a front-end library for building React components.
- Google Maps API and corresponding google-maps npm module
- Recharts - a composable charting library built on React components
- DynamoDB and GraphQL that comes when setting up AWS Amplify.
AWS Amplify is a framework that allows developers to easily develop and deploy cloud-powered mobile and web apps. We'll be using it to setup the Full-stack dashboard connecting the DynamoDB database containing the packet payload received from the edge device through the Helium Network and then visually displaying it on a fully hosted web URL.
We'll be referring to the detailed official documentation found here and the wonderful accompanying video guide found below.
It'll take quite some time to dig through and explain the full code in this part of the project. So I'll be summarizing it in the Front-end section and Back-end section as follows:
Dashboard Front-End
- AppBar.js contains code for the header of the Dashboard containing email alerts and navigation throughout the dashboard.
- AssetCard.js contains code for the average statistics of the Asset being monitored. It contains a button allowing you to generate a report based on the whole statistics of the Asset over time.
- Charts.js contains code to display the sensor readings obtained from the edge device in DynamoDB.
- Maps.js and GaugeSpeed.js contain code that displays where the Asset is realtime on a map and where it is supposed to be going. It also displays the acceleration & angular velocity values of the asset.
To use the Google Maps feature, you'll need to obtain your own key for access here and then replace your key under the Maps.js file as shown below.
Lastly, all these components are joined together in the AssetTracking.js file.
Dashboard Back-End
The great thing about developing this project on the Amplify Framework is that it can automatically set up the integration between your web-application and the DynamoDB database using GraphQL. GraphQL is an API query language which acts as the glue between client and server applications
First, specify the data you'll be getting from DynamoDB with the schema.graphql file once you've set up the full-stack project. Here we'll need the sensor values from the payload as follows:
Then type in the amplify push command to sync and update your local environment & resources to the cloud.
Three files, mutations.js, queries.js & subscriptions.js will automatically be generated for you. Simply put, these files are there to handle your data being either created, updated or deleted from your DynamoDB database. The most important thing is to be able to query the payload data to display in the Dashboard and this is found under the queries.js file.`
This GraphQL function is used to fetch the payload data in the front-end as shown
Publish Project
Once you've got your front-end and back-end nicely coupled together, it's time we build and publish the project.
First, build the project using the npm run build command
And then deploy it using the amplify publish command.
You should be able to see your hosted Dashboard URL once the project has been published/deployed and then visit the URL to view your project. Awesome!
Comments