


Hardware components | ||||||
 |
| × | 1 | |||
 |
| × | 1 | |||
 |
| × | 1 | |||
Software apps and online services | ||||||
 |
| |||||
If You want to read temperature, pressure and humidity from the webPage stored at free cloud its something for You. You don't need server, database, public IP or anything like this. I've used system RemoteMe it hosts your own webPages in the cloud, has databases You can use. Only You and people with special link has access to Your page. Whole projects is extremly easy, at the video I've showed evertyhing from the beggining so in 6 minutes You have your measurments available at your own website.
Enjoy
IntroducingThis time it will show how to read data from nodeMCU, WemOS, or similar via the Internet – The first example I will use is the temperature reading from the sensor connected to ESP on demand – YOu click refresh and immediately You got actual temperature, humidity, and pressure displayed at webPage
The second example is reading temperature, pressure, and humidity periodically and store it at the database, so You can later display some chart with historical data
You can watch all steps in youtubeTemperature pressure and humidity on demandAssumptionsAccess to the entire mechanism will be outside the local network, i.e. it will not be a problem to read the temperature from the phone mobile in the bus.
To read the temperature we will create synchronous communication, after sending a message to our ESP in response we will get temperature, humidity and pressure.
In general, to create this type of scenario, we must have access to our arduino from outside the local network – there are several solutions I will show you how to do it with remoteme.org
What we want to achieveA website with this appearance:
After loading the page, we display the current temperature, pressure and humidity, and of course the data are reload after clicking the Refresh button.
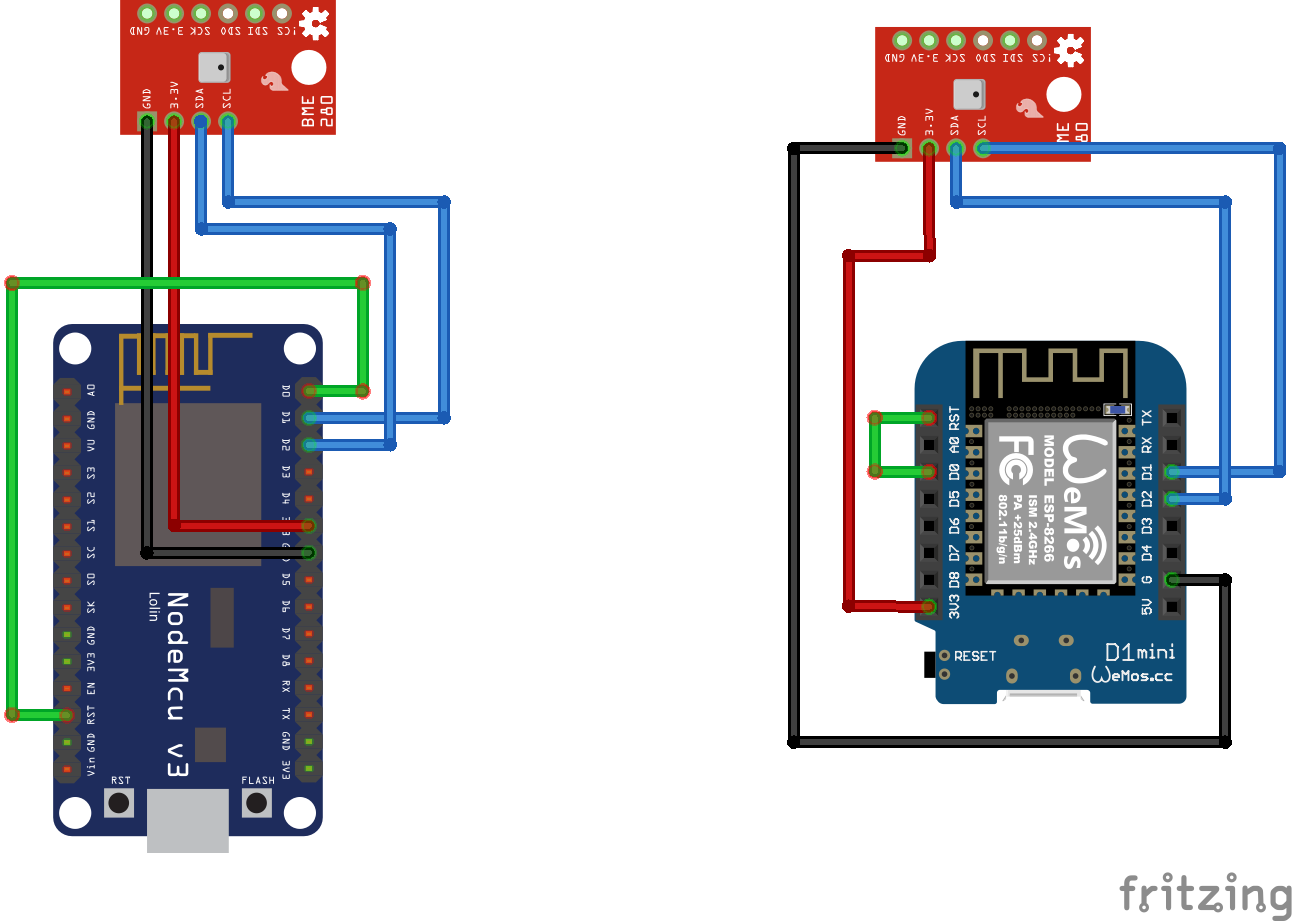
ComponentsGY-BME280 – as a thermometer, a hygrometer and a pressure meter in one
- nodeMCU or WemOS
Before we return to our arduino, let’s register our account in the system and create a token – the tasks described above.
Signup
- Sign Up tab
- you do not give your email so it is not possible to retrieve your password – you must remember it
- Click SignUp the system will login us immediately
Using the token added to the arduino program, arduino will be connected to our account.
- Go to the tab Tokens on the left
- Click New Token, complete the name (no matter what you type) and click OK
- [3] this is the only field you fill – the name of the token is only for us, it is not used anywhere except displaying the token in the token list.
- The token will be created:
- in my case token is “~267_ZxoWtJ)0ph&2c” it can be copied by clicking on the blue icon
all details in quickstart
needed libraries:
- Remoteme by remoteme.org
- WebSockets by Markus Sattler
- ArduinoHttpClient by Arduino
- ESP8266WiFi by Iven Grokhotkov
- SparkFun BME280 by SparkFun Electronics
Program for arduino can be copy from this link
I think that the program itself is quite readable, and the most important function of onUserSyncMessage I described below. Of course, we have to supplement our constants:
#define WIFI_NAME ""
#define WIFI_PASSWORD ""
#define DEVICE_ID 204
#define DEVICE_NAME "temperatureOnRequest"
#define TOKEN ""
In addition, description of the operation at the bottom of the article
Upload arduino program to device. After arduino launch in the Devices tab, our ESP will appear:
Now it’s time to create a website that will connect to our ESP and show the datas.
In the “Devices” tab, select the New button and then “New WebPage”
Now, let’s upload three files to our website.
- Files to upload index.html, script.js and styles.css are located here
- The easiest way is to simply drag files from github to our website, shown on the video
- We filled inputs as on the screen. Information what each field meansa you can find here.
- Opening of the website: click on the index.html file and select the Open in New Tab option. On the new tab will appear our website where after clicking Refresh the temperature, pressure and humidity will change to the current one.
Most important part of code is in the script.js file and in the arduino program. Let us discuss the following fragments:
script.js
function setup(){

	remoteme = new RemoteMe({
		automaticlyConnectWS: true,
		automaticlyConnectWebRTC:false,
		webSocketConnectionChange: webSocketConnectionChange,
		webRTCConnectionChange: undefined,
		mediaConstraints: {'mandatory': {'OfferToReceiveAudio': false, 'OfferToReceiveVideo': false}}
	});
}
standard settings. The program immediately connects and registers to the remoteme.org application.
Reference to the function
webSocketConnectionChange: webSocketConnectionChange,
the function itself looks like this:
function webSocketConnectionChange(state){

	if (state==WebsocketConnectingStatusEnum.CONNECTED){
		readDataNow();
	}
}
so after correct connection with remoteme.org, the program reads the data. The same readDataNow () function is called after clicking the “Refresh” button.
Let’s see what the readDataNow () function does:
function readDataNow(){
	remoteme.sendUserSyncMessageWebSocket(temperatureArduinoDeviceId,[],onResponse);
}
it sends the data to our ESP (that’s why you need the temperatureArduinoDeviceId which will indicate the ID (address of our ESP at our example it is 204) as data we send empty table: [], and after the response come the onResponse function should be called.
Let’s move to program on ESP and see how we handle incoming synchronous messages
arduino.ino:
void onUserSyncMessage(uint16_t senderDeviceId, uint16_t dataSize, uint8_t* data, uint16_t &returnDataSize, uint8_t *&returnData)
{
	uint16_t pos = 0;

	returnDataSize = sizeOf(float32)*3;
	returnData = (uint8_t*)malloc(returnDataSize);


	RemoteMeMessagesUtils::putFloat(returnData,pos, (mySensor.readTempC()));
	RemoteMeMessagesUtils::putFloat(returnData, pos, (mySensor.readFloatPressure() ));
	RemoteMeMessagesUtils::putFloat(returnData, pos, (mySensor.readFloatHumidity() ));


}
the above function will be called when a message arrives from script.js parameters:
returnData = (uint8_t*)malloc(returnDataSize);


	RemoteMeMessagesUtils::putFloat(returnData,pos, (mySensor.readTempC()));
	RemoteMeMessagesUtils::putFloat(returnData, pos, (mySensor.readFloatPressure() ));
	RemoteMeMessagesUtils::putFloat(returnData, pos, (mySensor.readFloatHumidity() ));
using the putFloat function, we enter three readings in the output table one by one. So after leaving the function, we have an array of bytes where the following numbers are written: temperature, pressure and humidity.
- senderDeviceId – id of our website
- dataSize – data size of data (at our case its 0 becasue we sent empty array at script.js)
- data -data from websote (at our case there is nothing here)
- returnDataSize – here we will enter how many bytes we will send as the answer – we send 12 because we have three readings, and each is a float number that has 4 bytes
- returnData – here we write return data
Let’s go back to the script.js file and read these values:
script.js
function onResponse(output){
	var data = new RemoteMeData(output);

	var temp = data.popFloat32();
	var pressure = data.popFloat32();
	var humm = data.popFloat32();

	$("#tempOut").html(temp.toFixed(2)+" C");
	$("#pressOut").html((pressure/100).toFixed(2)+" hPa");
	$("#hummOut").html(humm.toFixed(2)+" %");

}
with the popFloat32 pop function, we collect three float numbers one by one and after proper formatting, we display with jquery to the appropriate elements.
Temperature pressure and humidity saved on the server and displayed on the chartThis time we dont want to read the temperatures on demand but save the readings from time to time (in the example 5 minutes intervals ) to the server and see the data on the chart
How does it workESP from time to time wakes up from deepSleep mode, reads data from GY-BME280 and saves them to the server, then again fall asleep and wake up sends data, and so on.
Of course, you do not need your own database – remoteme.org provides functions to write data to the cloud – and provides API to read them
The chart we get:
Almost identical as in the project for reading on demand, the difference is the green wire – it allows you to self-wakeup the ESP.
Source codeJust upload to remoteme.org and our arduino . Everything in the same way as in the previous example.
Description of the most interesting code partsarduino:
data reading from BMY280:
double temp[10];
  double pressure[10];
  double humm[10];
  for(int i=0;i<9;i++){
    temp[i]= mySensor.readTempC();
    pressure[i]= mySensor.readFloatPressure();
    humm[i]= mySensor.readFloatHumidity();
    delay(100);
  }

  sort(temp,10);
  sort(humm,10);
  sort(pressure,10);
We make 9 measurements in a 100ms interval, then sort them, send medians to the server – it will allow you to get rid of wrong data – sometimes our sensor returns strange values
remoteMe.sendAddDataMessage(1, RemotemeStructures::_5M, 0, temp[5]);
remoteMe.sendAddDataMessage(2, RemotemeStructures::_5M, 0, pressure[5]);
remoteMe.sendAddDataMessage(3, RemotemeStructures::_5M, 0,humm[5])
and send them to the server, each data is sotred at diffrent data series (1, 2, 3) and time is rounded to 5minutes – it will helps draw nicer chart
after the measurements ESP falls asleep for 4 minutes
ESP.deepSleep(1e6*60*4);//4min
script.js
The most interesting part is receiving data and display them on the chart.
function createChart(){

   var yestarday=moment().subtract(1, 'days').format("DD.MM.YYYY HH:mm");
   var now=moment().format("DD.MM.YYYY HH:mm");


	var url =`/api/rest/v1/data/get/dd.MM.yyyy HH:mm/${yestarday}/${now}/1,2,3/`;

	$.get(url, function(data, status){
applications provide our data under the link
(documentation of the entire REST Api remoteme.org app is here )
/api/rest/v1/data/get/{FORMAT}/{FROM}/{TO}/{SERIES ids}/
URL will returns us data for series which was provided in {SERIES ids} time will be formatting using {FORMAT} and data will be from [ {FROM} – {TO} [period. Data are return as json
in our example, javascript will generate a link:
http://app.remoteme.org/api/rest/v1/data/get/dd.MM.yyyy HH:mm/02.06.2018 18:53/03.06.2018 18:53/1,2,3/
data are reads for one day back. You can easy change it
Let’s check what I find under the given link (I limited the time to 20 minutes)
“dataSeriesId” is id of our data series so under dataseriesId:1 will be temperature becasuse at arduino we have
remoteMe.sendAddDataMessage(1, RemotemeStructures::_5M, 0, temp[5]);
and first function argument means dataseries 1
becasue in the link we have 1, 2, 3 as series ID, all series are returned all together
Then download jeson is displayed using plotly :
To see this chart You have to open index.html excatly as You did at previous example
Whole function and api documentation You can find here ,
Cheers,
Maciek
Comments