
Hardware components | ||||||
| × | 1 | ||||
| × | 1 | ||||
| × | 1 | ||||
 |
| × | 1 | |||
Software apps and online services | ||||||
 |
| |||||
 |
| |||||
This article follows the tutorial about how to create a LoRa/LoraWAN network programmed in Python using Zerynth and connected to The Things Network.
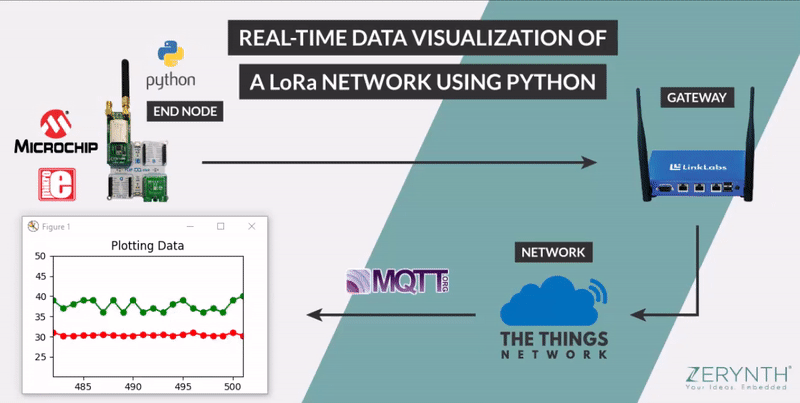
Starting with the same setup of the previous project, we’ll see how to get and visualize sensor data of LoRa nodes using Zerynth, The Things Network and Matplotlib, a very popular Python plotting library.
You will see how to:
- program a LoRa node in Python using Zerynth to get temperature and humidity data;
- send data to The Things Network,going through a LoRa Gateway;
- get data from The Things Network console via MQTT;
- plot sensor data using Matplotlib.
Essentially, we need the same configuration used for the previous project, plus a temperature and humidity sensor:
- LoRa Gateway. In this tutorial we’ve used a Link Labs BS-8, an industrial-grade IoT/M2M gateway for use with LoRa networks. It’s capable of supporting thousands of endpoints with 8 simultaneous receive channels.
- LoRa end-node. In this tutorial we’ve used we’ve used Flip&Click as MCU board, a LoRa Click and a Temp&Hum Click, that carries ST’s HTS221 temperature and relative humidity sensor.
- Zerynth Studio: our professional IDE that provides a platform for developing your Python or hybrid C/Python code and managing your boards. It includes a compiler, debugger and an editor, alongside tutorials and example projects for an easy learning experience.
- TTN (The Things Network) Console: you need to create/register an account entering a username and an email address.
After the LoRa Gateway configuration and the LoRa node configuration steps are performed (see the previous project), we’ll be able to program the device to get data from the Temp&Hum Click and to send these values to The Things Network console.
In particular, we have to create a new project on Zerynth Studio and paste this code:
# LoraWAN sensor data Logging

import streams
from microchip.rn2483 import rn2483
from stm.hts221 import hts221

streams.serial()

try:
    rst = D16 # reset pin
    # insert otaa credentials!
    appeui = "YOUAPPEUI"
    appkey =  "YOUAPPKEY"
    print("joining...")

    if not rn2483.init(SERIAL1, appeui, appkey, rst): # LoRa Click on slot A
        print("denied :(")
        raise Exception

    print("sending first message, res:")
    print(rn2483.tx_uncnf('TTN'))

    temp_hum = hts221.HTS221( I2C1,D31 ) # Temp Hum Click on slot C

    while True:
        temp, hum = temp_hum.get_temp_humidity()
        print('temp: ', temp, 'hum: ', hum)
        data = bytearray(4)
        data[0:2] = bytearray([ int(temp) + 127, int((temp - int(temp)) * 100) ])
        data[2:4] = bytearray([ int(hum) + 127, int((hum - int(hum)) * 100) ])
        r = rn2483.tx_uncnf(data) # send data to TTN
        sleep(5000)

except Exception as e:
    print(e)
Edit the lines with the “appeui” and the “appkey” values that you can find in the Device Overview on the TTN Console.
Uplink the code to your board and you’re done!
Now click on the “Data” tab of the TTN Console and you can see your sensor data sent by the LoRa node!
As you can see, this script is very similar to the “ping” example used on the previous project. The only differences are related to the usage of the HTS221 temperature and humidity sensor carried by the Temp&Hum Click. Thanks to Zerynth, you need just a few lines of Python and you can get real data from a sensor and send it to a LoRa network!
Getting data from The Things Network console via MQTTNow it’s time to get data from the TTN Console. To do this, we’ve prepared a very simple Python script that utilizes the Eclipse Paho MQTT Python client library, which implements versions 3.1 and 3.1.1 of the MQTT protocol.
Note that you have to run this script on your laptop, so you need Python (3.x) installed on your PC.
get_plot_data_TTN.py:
# Get and plot data from TTN Console using Python

import paho.mqtt.client as mqtt
import json
import base64

APPEUI = 'YOURAPPEUI'
APPID  = 'YOUAPPID'
PSW    = 'YOURPASSWORD'

import matplotlib.pyplot as plt
#import DataPlot and RealtimePlot from the file plot_data.py
from plot_data import DataPlot, RealtimePlot

fig, axes = plt.subplots()
plt.title('Data from TTN console')

data = DataPlot()
dataPlotting= RealtimePlot(axes)

count=0

def bytes_to_decimal(i,d):
    xx = i - 127
    dec = (-d if xx < 0 else d)/100
    return xx + dec

def on_connect(client, userdata, flags, rc):
    client.subscribe('+/devices/+/up'.format(APPEUI))

def on_message(client, userdata, msg):
    j_msg = json.loads(msg.payload.decode('utf-8'))
    dev_eui = j_msg['hardware_serial']

    tmp_hum = base64.b64decode(j_msg['payload_raw'])
    tmp = bytes_to_decimal(*tmp_hum[0:2])
    hum = bytes_to_decimal(*tmp_hum[2:4])

    # print data
    print('---')
    print('tmp:', tmp, ' hum:', hum)
    print('dev eui: ', dev_eui)

    # plot data
    global count
    count+=1
    data.add(count, tmp , hum)
    dataPlotting.plot(data)
    plt.pause(0.001)

# set paho.mqtt callback
ttn_client = mqtt.Client()
ttn_client.on_connect = on_connect
ttn_client.on_message = on_message
ttn_client.username_pw_set(APPID, PSW)
ttn_client.connect("eu.thethings.network", 1883, 60) #MQTT port over TLS

try:
    ttn_client.loop_forever()
except KeyboardInterrupt:
    print('disconnect')
    ttn_client.disconnect()
Once you have the data in your computer, you can do all sorts of things with it. In this case, we want to read these temperature and humidity values and plot them as a function of time.
As we love Python, we’ve prepared a script called “plot_data.py” that uses the Matplotlib library for this.
plot_data.py:
import time
import math
from collections import deque , defaultdict

import matplotlib.animation as animation
from matplotlib import pyplot as plt

import threading

from random import randint

from statistics import *

class DataPlot:
    def __init__(self, max_entries = 20):
        self.axis_x = deque(maxlen=max_entries)
        self.axis_y = deque(maxlen=max_entries)
        self.axis_y2 = deque(maxlen=max_entries)

        self.max_entries = max_entries

        self.buf1=deque(maxlen=5)
        self.buf2=deque(maxlen=5)


    def add(self, x, y,y2):

        self.axis_x.append(x)
        self.axis_y.append(y)
        self.axis_y2.append(y2)

class RealtimePlot:
    def __init__(self, axes):

        self.axes = axes

        self.lineplot, = axes.plot([], [], "ro-")
        self.lineplot2, = axes.plot([], [], "go-")

    def plot(self, dataPlot):
        self.lineplot.set_data(dataPlot.axis_x, dataPlot.axis_y)
        self.lineplot2.set_data(dataPlot.axis_x, dataPlot.axis_y2)

        self.axes.set_xlim(min(dataPlot.axis_x), max(dataPlot.axis_x))
        ymin = min([min(dataPlot.axis_y), min(dataPlot.axis_y2)])-10
        ymax = max([max(dataPlot.axis_y), max(dataPlot.axis_y2)])+10
        self.axes.set_ylim(ymin,ymax)
        self.axes.relim();

def main():
    fig, axes = plt.subplots()
    plt.title('Plotting Data')

    data = DataPlot();
    dataPlotting= RealtimePlot(axes)

    try:
        count=0
        while True:
            count+=1
            data.add(count, 30 + 1/randint(1,5) , 35 + randint(1,5))
            dataPlotting.plot(data)

            plt.pause(0.001)
    except KeyboardInterrupt:
        print('\n\nKeyboard exception received. Exiting.')
        plt.close()
        ser.close()
        exit()

if __name__ == "__main__": main()
Note that you have to import this file in the previous script to work properly. And here is what the plot looks like. It scrolls to the right as data keeps coming in.
Expand your LoRa network with Zerynth Studio PROThe following list includes some of the LoRa key features:
- Long range: 15 – 20 km;
- Long battery life: in excess of ten years;
- Millions of nodes!
The free version of Zerynth Studio allows you to use all the features you need to prototype your LoRa solutions but you can program for free up to 5 units of each supported board. You can unlock this limit with the Zerynth Studio PRO version (available from June 28 and in pre-order with up to 50% discount), that will also include industrial-grade features like:
- Selectable RTOS;
- Over the Air update development;
- Hardware-driven Secured Firmware burned on the device at industrial volumes;
- …and much more
via Zerynth Academy


Comments