

Hardware components | ||||||
_xcg7vos8ax_LjVH1Q6mKB.png?auto=compress%2Cformat&w=48&h=48&fit=fill&bg=ffffff) |
| × | 1 | |||
| × | 1 | ||||
| × | 1 | ||||
Software apps and online services | ||||||
 |
| |||||
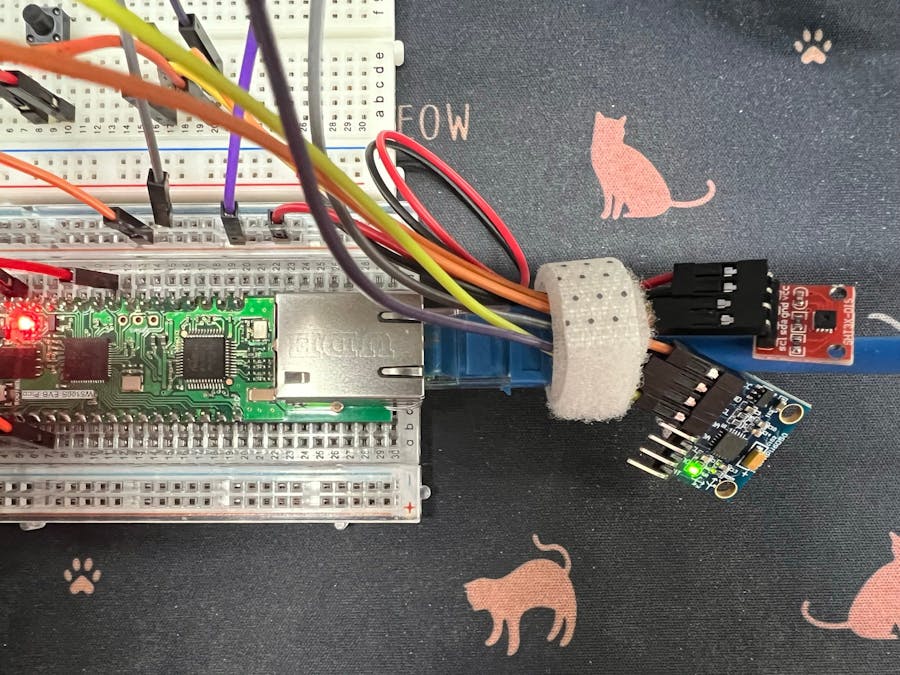
The ethernet is a basic communication technology for remote monitoring. The W5100S-EVB-Pico combined RP2040 and W5100S to use ethernet.
There are RP2040 FreeRTOS Examples that can use with W5100S-EVB-Pico. And I try to connect some sensors.
: Humidity and Temperature Sensor
: Integrated 6-axis MotionTracking device that combines a 3-axis gyroscope, 3-axis accelerometer, and a Digital Motion Processor.
These are I2C interface devices. Fortunately, the pico-examples provide a good reference for I2C.
The W5100S-EVB-Pico gets data from sensors every 2 seconds, and it sends data to TCP Client which is connected.
The Node-RED connects to W5100S-EVB-Pico as a TCP Client. It shows data on the widget.
Finally, I can create a task for sensing and I can show my Node-RED dashboard.
Thank you for reading this.
[
{
"id": "e7cae84a2c3f73bf",
"type": "tab",
"label": "Flow 1",
"disabled": false,
"info": "",
"env": []
},
{
"id": "4f48e7ad3b019333",
"type": "tcp in",
"z": "e7cae84a2c3f73bf",
"name": "",
"server": "client",
"host": "192.168.0.62",
"port": "5000",
"datamode": "stream",
"datatype": "utf8",
"newline": "",
"topic": "",
"base64": false,
"x": 140,
"y": 160,
"wires": [
[
"c41ea4ede2e5e5d7",
"1583bc5e53547c66",
"b957d62a73988fdb",
"fca1f676191d93e6",
"f8cf7a337fd52794",
"c522016737ef6ed6",
"0906a0e35fda6802",
"e0f367090178d90c",
"7c1effd615744c3d"
]
]
},
{
"id": "ba6345527c734a24",
"type": "ui_gauge",
"z": "e7cae84a2c3f73bf",
"name": "",
"group": "2b2c73d8e1e0b8a2",
"order": 2,
"width": 3,
"height": 3,
"gtype": "gage",
"title": "Temperature",
"label": "C",
"format": "{{value}}",
"min": "-20",
"max": "100",
"colors": [
"#00b500",
"#e6e600",
"#ca3838"
],
"seg1": "",
"seg2": "",
"className": "",
"x": 590,
"y": 320,
"wires": []
},
{
"id": "aa999e85b6c7e72c",
"type": "ui_chart",
"z": "e7cae84a2c3f73bf",
"name": "",
"group": "2b2c73d8e1e0b8a2",
"order": 1,
"width": 9,
"height": 3,
"label": "Temperature",
"chartType": "line",
"legend": "false",
"xformat": "HH:mm:ss",
"interpolate": "linear",
"nodata": "",
"dot": false,
"ymin": "",
"ymax": "",
"removeOlder": 1,
"removeOlderPoints": "",
"removeOlderUnit": "3600",
"cutout": 0,
"useOneColor": false,
"useUTC": false,
"colors": [
"#1f77b4",
"#aec7e8",
"#ff7f0e",
"#2ca02c",
"#98df8a",
"#d62728",
"#ff9896",
"#9467bd",
"#c5b0d5"
],
"outputs": 1,
"useDifferentColor": false,
"className": "",
"x": 590,
"y": 280,
"wires": [
[]
]
},
{
"id": "c41ea4ede2e5e5d7",
"type": "debug",
"z": "e7cae84a2c3f73bf",
"name": "",
"active": false,
"tosidebar": true,
"console": false,
"tostatus": false,
"complete": "payload",
"targetType": "msg",
"statusVal": "",
"statusType": "auto",
"x": 390,
"y": 140,
"wires": []
},
{
"id": "1583bc5e53547c66",
"type": "function",
"z": "e7cae84a2c3f73bf",
"name": "temperature",
"func": "var output = msg.payload.split(\",\");\nvar temperature = parseFloat(output[0]);\nmsg = {payload:temperature};\n\nreturn msg;",
"outputs": 1,
"noerr": 0,
"initialize": "",
"finalize": "",
"libs": [],
"x": 390,
"y": 240,
"wires": [
[
"fc4bf7cb8c5ef32e",
"ba6345527c734a24",
"aa999e85b6c7e72c"
]
]
},
{
"id": "fc4bf7cb8c5ef32e",
"type": "debug",
"z": "e7cae84a2c3f73bf",
"name": "",
"active": false,
"tosidebar": true,
"console": false,
"tostatus": false,
"complete": "false",
"statusVal": "",
"statusType": "auto",
"x": 590,
"y": 240,
"wires": []
},
{
"id": "b957d62a73988fdb",
"type": "function",
"z": "e7cae84a2c3f73bf",
"name": "humidity",
"func": "var output = msg.payload.split(\",\");\nvar temperature = parseFloat(output[1]);\nmsg = {payload:temperature};\n\nreturn msg;",
"outputs": 1,
"noerr": 0,
"initialize": "",
"finalize": "",
"libs": [],
"x": 380,
"y": 380,
"wires": [
[
"9a713e4fa5572b62",
"afebf8077ffc400a",
"d0f484149cb83c88"
]
]
},
{
"id": "9a713e4fa5572b62",
"type": "debug",
"z": "e7cae84a2c3f73bf",
"name": "",
"active": false,
"tosidebar": true,
"console": false,
"tostatus": false,
"complete": "false",
"statusVal": "",
"statusType": "auto",
"x": 590,
"y": 380,
"wires": []
},
{
"id": "fca1f676191d93e6",
"type": "function",
"z": "e7cae84a2c3f73bf",
"name": "accel.x",
"func": "var output = msg.payload.split(\",\");\nvar temperature = parseFloat(output[2]);\nmsg = {payload:temperature};\n\nreturn msg;",
"outputs": 1,
"noerr": 0,
"initialize": "",
"finalize": "",
"libs": [],
"x": 320,
"y": 520,
"wires": [
[
"e748f26943557560",
"1f0ed7ae1882b0e5"
]
]
},
{
"id": "f8cf7a337fd52794",
"type": "function",
"z": "e7cae84a2c3f73bf",
"name": "accel.y",
"func": "var output = msg.payload.split(\",\");\nvar temperature = parseFloat(output[3]);\nmsg = {payload:temperature};\n\nreturn msg;",
"outputs": 1,
"noerr": 0,
"initialize": "",
"finalize": "",
"libs": [],
"x": 320,
"y": 560,
"wires": [
[
"22daad1343193f21",
"e7c7dbe011b8c680"
]
]
},
{
"id": "c522016737ef6ed6",
"type": "function",
"z": "e7cae84a2c3f73bf",
"name": "accel.z",
"func": "var output = msg.payload.split(\",\");\nvar temperature = parseFloat(output[4]);\nmsg = {payload:temperature};\n\nreturn msg;",
"outputs": 1,
"noerr": 0,
"initialize": "",
"finalize": "",
"libs": [],
"x": 310,
"y": 600,
"wires": [
[
"281cc5e08fc2c463",
"1099ea35f5dc712d"
]
]
},
{
"id": "0906a0e35fda6802",
"type": "function",
"z": "e7cae84a2c3f73bf",
"name": "gyro.x",
"func": "var output = msg.payload.split(\",\");\nvar temperature = parseFloat(output[5]);\nmsg = {payload:temperature};\n\nreturn msg;",
"outputs": 1,
"noerr": 0,
"initialize": "",
"finalize": "",
"libs": [],
"x": 310,
"y": 800,
"wires": [
[
"ac30282890ec5644",
"4d4b0ca2871a8041"
]
]
},
{
"id": "e0f367090178d90c",
"type": "function",
"z": "e7cae84a2c3f73bf",
"name": "gyro.y",
"func": "var output = msg.payload.split(\",\");\nvar temperature = parseFloat(output[6]);\nmsg = {payload:temperature};\n\nreturn msg;",
"outputs": 1,
"noerr": 0,
"initialize": "",
"finalize": "",
"libs": [],
"x": 310,
"y": 840,
"wires": [
[
"b0f8faacaa46e370",
"88c2d7f680574b0a"
]
]
},
{
"id": "7c1effd615744c3d",
"type": "function",
"z": "e7cae84a2c3f73bf",
"name": "gyro.z",
"func": "var output = msg.payload.split(\",\");\nvar temperature = parseFloat(output[7]);\nmsg = {payload:temperature};\n\nreturn msg;",
"outputs": 1,
"noerr": 0,
"initialize": "",
"finalize": "",
"libs": [],
"x": 310,
"y": 880,
"wires": [
[
"3fd468d7c9d24589",
"44170801299959c0"
]
]
},
{
"id": "e748f26943557560",
"type": "ui_chart",
"z": "e7cae84a2c3f73bf",
"name": "",
"group": "2b2c73d8e1e0b8a2",
"order": 5,
"width": 9,
"height": 3,
"label": "Accl.x",
"chartType": "line",
"legend": "false",
"xformat": "HH:mm:ss",
"interpolate": "linear",
"nodata": "",
"dot": false,
"ymin": "",
"ymax": "",
"removeOlder": 1,
"removeOlderPoints": "",
"removeOlderUnit": "3600",
"cutout": 0,
"useOneColor": false,
"useUTC": false,
"colors": [
"#1f77b4",
"#aec7e8",
"#ff7f0e",
"#2ca02c",
"#98df8a",
"#d62728",
"#ff9896",
"#9467bd",
"#c5b0d5"
],
"outputs": 1,
"useDifferentColor": false,
"className": "",
"x": 510,
"y": 520,
"wires": [
[]
]
},
{
"id": "22daad1343193f21",
"type": "ui_chart",
"z": "e7cae84a2c3f73bf",
"name": "",
"group": "2b2c73d8e1e0b8a2",
"order": 9,
"width": 9,
"height": 3,
"label": "Accl.y",
"chartType": "line",
"legend": "false",
"xformat": "HH:mm:ss",
"interpolate": "linear",
"nodata": "",
"dot": false,
"ymin": "",
"ymax": "",
"removeOlder": 1,
"removeOlderPoints": "",
"removeOlderUnit": "3600",
"cutout": 0,
"useOneColor": false,
"useUTC": false,
"colors": [
"#1f77b4",
"#aec7e8",
"#ff7f0e",
"#2ca02c",
"#98df8a",
"#d62728",
"#ff9896",
"#9467bd",
"#c5b0d5"
],
"outputs": 1,
"useDifferentColor": false,
"className": "",
"x": 510,
"y": 600,
"wires": [
[]
]
},
{
"id": "281cc5e08fc2c463",
"type": "ui_chart",
"z": "e7cae84a2c3f73bf",
"name": "",
"group": "2b2c73d8e1e0b8a2",
"order": 13,
"width": 9,
"height": 3,
"label": "Accl.z",
"chartType": "line",
"legend": "false",
"xformat": "HH:mm:ss",
"interpolate": "linear",
"nodata": "",
"dot": false,
"ymin": "",
"ymax": "",
"removeOlder": 1,
"removeOlderPoints": "",
"removeOlderUnit": "3600",
"cutout": 0,
"useOneColor": false,
"useUTC": false,
"colors": [
"#1f77b4",
"#aec7e8",
"#ff7f0e",
"#2ca02c",
"#98df8a",
"#d62728",
"#ff9896",
"#9467bd",
"#c5b0d5"
],
"outputs": 1,
"useDifferentColor": false,
"className": "",
"x": 510,
"y": 680,
"wires": [
[]
]
},
{
"id": "1f0ed7ae1882b0e5",
"type": "ui_gauge",
"z": "e7cae84a2c3f73bf",
"name": "",
"group": "2b2c73d8e1e0b8a2",
"order": 6,
"width": 3,
"height": 3,
"gtype": "gage",
"title": "Accl.x",
"label": "",
"format": "{{value}}",
"min": "-3",
"max": "3",
"colors": [
"#00b500",
"#e6e600",
"#ca3838"
],
"seg1": "",
"seg2": "",
"className": "",
"x": 510,
"y": 560,
"wires": []
},
{
"id": "e7c7dbe011b8c680",
"type": "ui_gauge",
"z": "e7cae84a2c3f73bf",
"name": "",
"group": "2b2c73d8e1e0b8a2",
"order": 10,
"width": 3,
"height": 3,
"gtype": "gage",
"title": "Accl.y",
"label": "",
"format": "{{value}}",
"min": "-3",
"max": "3",
"colors": [
"#00b500",
"#e6e600",
"#ca3838"
],
"seg1": "",
"seg2": "",
"className": "",
"x": 510,
"y": 640,
"wires": []
},
{
"id": "1099ea35f5dc712d",
"type": "ui_gauge",
"z": "e7cae84a2c3f73bf",
"name": "",
"group": "2b2c73d8e1e0b8a2",
"order": 14,
"width": 3,
"height": 3,
"gtype": "gage",
"title": "Accl.z",
"label": "",
"format": "{{value}}",
"min": "-3",
"max": "3",
"colors": [
"#00b500",
"#e6e600",
"#ca3838"
],
"seg1": "",
"seg2": "",
"className": "",
"x": 510,
"y": 720,
"wires": []
},
{
"id": "afebf8077ffc400a",
"type": "ui_chart",
"z": "e7cae84a2c3f73bf",
"name": "",
"group": "2b2c73d8e1e0b8a2",
"order": 3,
"width": 9,
"height": 3,
"label": "Humidity",
"chartType": "line",
"legend": "false",
"xformat": "HH:mm:ss",
"interpolate": "linear",
"nodata": "",
"dot": false,
"ymin": "",
"ymax": "",
"removeOlder": 1,
"removeOlderPoints": "",
"removeOlderUnit": "3600",
"cutout": 0,
"useOneColor": false,
"useUTC": false,
"colors": [
"#1f77b4",
"#aec7e8",
"#ff7f0e",
"#2ca02c",
"#98df8a",
"#d62728",
"#ff9896",
"#9467bd",
"#c5b0d5"
],
"outputs": 1,
"useDifferentColor": false,
"className": "",
"x": 580,
"y": 420,
"wires": [
[]
]
},
{
"id": "d0f484149cb83c88",
"type": "ui_gauge",
"z": "e7cae84a2c3f73bf",
"name": "",
"group": "2b2c73d8e1e0b8a2",
"order": 4,
"width": 3,
"height": 3,
"gtype": "gage",
"title": "Humidity",
"label": "%",
"format": "{{value}}",
"min": 0,
"max": "100",
"colors": [
"#00b500",
"#e6e600",
"#ca3838"
],
"seg1": "",
"seg2": "",
"className": "",
"x": 580,
"y": 460,
"wires": []
},
{
"id": "ac30282890ec5644",
"type": "ui_chart",
"z": "e7cae84a2c3f73bf",
"name": "",
"group": "2b2c73d8e1e0b8a2",
"order": 7,
"width": 9,
"height": 3,
"label": "Gyro.x",
"chartType": "line",
"legend": "false",
"xformat": "HH:mm:ss",
"interpolate": "linear",
"nodata": "",
"dot": false,
"ymin": "",
"ymax": "",
"removeOlder": 1,
"removeOlderPoints": "",
"removeOlderUnit": "3600",
"cutout": 0,
"useOneColor": false,
"useUTC": false,
"colors": [
"#1f77b4",
"#aec7e8",
"#ff7f0e",
"#2ca02c",
"#98df8a",
"#d62728",
"#ff9896",
"#9467bd",
"#c5b0d5"
],
"outputs": 1,
"useDifferentColor": false,
"className": "",
"x": 510,
"y": 800,
"wires": [
[]
]
},
{
"id": "4d4b0ca2871a8041",
"type": "ui_gauge",
"z": "e7cae84a2c3f73bf",
"name": "",
"group": "2b2c73d8e1e0b8a2",
"order": 8,
"width": 3,
"height": 3,
"gtype": "gage",
"title": "Gyro.x",
"label": "",
"format": "{{value}}",
"min": "-1000",
"max": "1000",
"colors": [
"#00b500",
"#e6e600",
"#ca3838"
],
"seg1": "",
"seg2": "",
"className": "",
"x": 510,
"y": 840,
"wires": []
},
{
"id": "b0f8faacaa46e370",
"type": "ui_chart",
"z": "e7cae84a2c3f73bf",
"name": "",
"group": "2b2c73d8e1e0b8a2",
"order": 11,
"width": 9,
"height": 3,
"label": "Gyro.y",
"chartType": "line",
"legend": "false",
"xformat": "HH:mm:ss",
"interpolate": "linear",
"nodata": "",
"dot": false,
"ymin": "",
"ymax": "",
"removeOlder": 1,
"removeOlderPoints": "",
"removeOlderUnit": "3600",
"cutout": 0,
"useOneColor": false,
"useUTC": false,
"colors": [
"#1f77b4",
"#aec7e8",
"#ff7f0e",
"#2ca02c",
"#98df8a",
"#d62728",
"#ff9896",
"#9467bd",
"#c5b0d5"
],
"outputs": 1,
"useDifferentColor": false,
"className": "",
"x": 510,
"y": 880,
"wires": [
[]
]
},
{
"id": "88c2d7f680574b0a",
"type": "ui_gauge",
"z": "e7cae84a2c3f73bf",
"name": "",
"group": "2b2c73d8e1e0b8a2",
"order": 12,
"width": 3,
"height": 3,
"gtype": "gage",
"title": "Gyro.y",
"label": "",
"format": "{{value}}",
"min": "-1000",
"max": "1000",
"colors": [
"#00b500",
"#e6e600",
"#ca3838"
],
"seg1": "",
"seg2": "",
"className": "",
"x": 510,
"y": 920,
"wires": []
},
{
"id": "3fd468d7c9d24589",
"type": "ui_chart",
"z": "e7cae84a2c3f73bf",
"name": "",
"group": "2b2c73d8e1e0b8a2",
"order": 15,
"width": 9,
"height": 3,
"label": "Gyro.z",
"chartType": "line",
"legend": "false",
"xformat": "HH:mm:ss",
"interpolate": "linear",
"nodata": "",
"dot": false,
"ymin": "",
"ymax": "",
"removeOlder": 1,
"removeOlderPoints": "",
"removeOlderUnit": "3600",
"cutout": 0,
"useOneColor": false,
"useUTC": false,
"colors": [
"#1f77b4",
"#aec7e8",
"#ff7f0e",
"#2ca02c",
"#98df8a",
"#d62728",
"#ff9896",
"#9467bd",
"#c5b0d5"
],
"outputs": 1,
"useDifferentColor": false,
"className": "",
"x": 510,
"y": 960,
"wires": [
[]
]
},
{
"id": "44170801299959c0",
"type": "ui_gauge",
"z": "e7cae84a2c3f73bf",
"name": "",
"group": "2b2c73d8e1e0b8a2",
"order": 16,
"width": 3,
"height": 3,
"gtype": "gage",
"title": "Gyro.z",
"label": "",
"format": "{{value}}",
"min": "-1000",
"max": "1000",
"colors": [
"#00b500",
"#e6e600",
"#ca3838"
],
"seg1": "",
"seg2": "",
"className": "",
"x": 510,
"y": 1000,
"wires": []
},
{
"id": "2b2c73d8e1e0b8a2",
"type": "ui_group",
"name": "",
"tab": "4e3ec7bc780f9d95",
"order": 1,
"disp": true,
"width": "24",
"collapse": false,
"className": ""
},
{
"id": "4e3ec7bc780f9d95",
"type": "ui_tab",
"name": "Home",
"icon": "dashboard",
"disabled": false,
"hidden": false
}
]

Comments