


Hardware components | ||||||
 |
| × | 1 | |||
 |
| × | 1 | |||
 |
| × | 1 | |||
| × | 1 | ||||
| × | 1 | ||||
 |
| × | 1 | |||
Software apps and online services | ||||||
| ||||||
 |
| |||||
Hand tools and fabrication machines | ||||||
 |
| |||||
If you grew up playing RollerCoaster Tycoon, you know the feeling: you build a coaster, open it to guests, and hold your breath while the game calculates the Excitement, Intensity, and Nausea ratings. Too intense? Nobody rides. Too boring? Nobody rides. Getting all three numbers right was the whole game.
I always wondered what real coasters would score. I wanted to build a wearable to help you find out.
Fortunately for me, in 1962 Melba Stone inadvertently invented the ultimate enclosure for such a wearable while observing kangaroos- the fanny pack. Strap an Arduino UNO Q and an IMU into a fanny pack, ride a real coaster, and get your Excitement, Intensity, and Nausea scores displayed in a RCT-styled interface on your phone. Then share the results to social media, just like sharing a screenshot of your best coaster build.
Check out how these real coasters at Adventureland did!
The system has three stages, mirroring how the original game calculates its ratings:
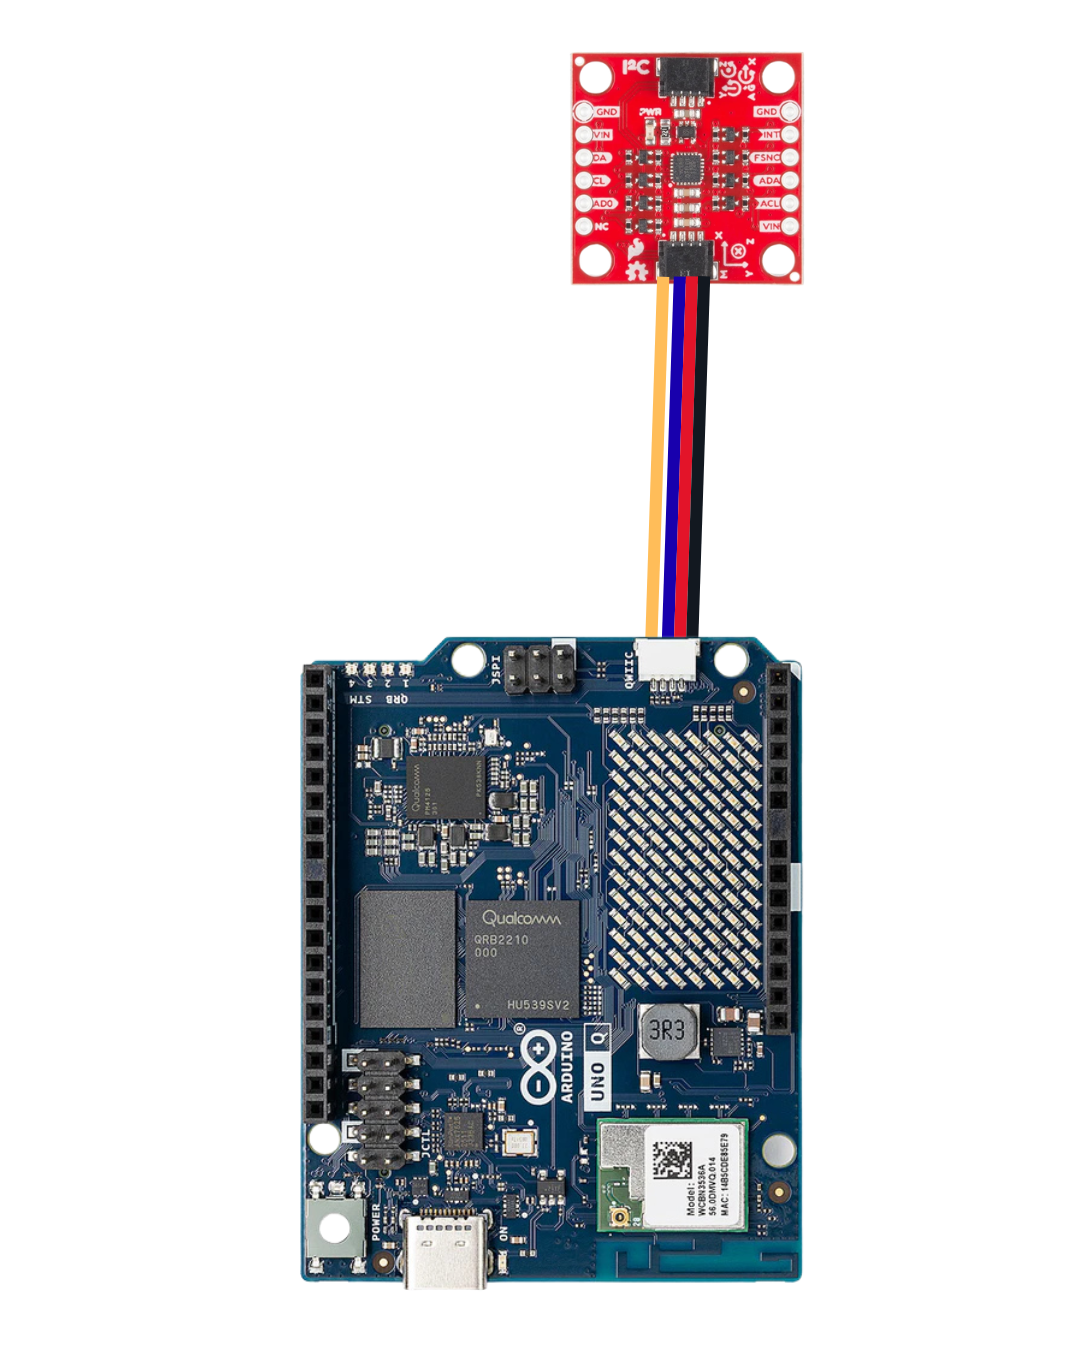
Record: You hit Start on your phone while standing in the queue. The SparkFun ICM-20948 IMU starts sampling acceleration and rotation at 200Hz, streaming data from the Arduino UNO Q's STM32 microcontroller to the Qualcomm Dragonwing MPU over the internal Bridge.
Process: After the ride, you hit Stop. Python code running on the Qualcomm side extracts physical ride metrics from the raw sensor data- peak G-forces, lateral forces, airtime duration, and more. The first few seconds of data (while you're standing still in line) are used to calibrate which direction is "down, " so the IMU's orientation in the fanny pack doesn't matter.
Predict: Those extracted features feed into three Edge Impulse regression models, one each for Excitement, Intensity, and Nausea, trained on actual RollerCoaster Tycoon 2 game data. The models output scores on the classic 0-10 scale, displayed in a WebUI that looks like it was pulled straight from the game.
The complete project is available as a ready-to-import bundle on the Arduino Project Hub:
RollerCoasterTestMeter on Arduino Project Hub
Download the ZIP, then in Arduino App Lab go to My Apps → Create new app+ and import the ZIP file. The bundle includes the sketch, Python code, WebUI, vendored libraries, and the pre-trained Edge Impulse models. Everything you need to get running.
After importing, install these sketch libraries if they aren't already present:
- SparkFun 9DoF IMU Breakout - ICM 20948 - Arduino Library
- Arduino_RouterBridge (usually pre-installed)
Time to gather your materials.
Assembly is simple, and requires no tools! The UNO Q's dual-brain architecture does all the heavy lifting. The STM32 handles real-time sensor sampling while the Qualcomm MPU runs Python, ML inference, and a web server simultaneously. No laptop needed at the park.
The wiring is one cable. The SparkFun breakout connects to the UNO Q's Qwiic port. plug it in and you're done. Make sure you connect to the Qwiic side of the Sparkfun board, not the i2c side.
For the "enclosure, " I used 3M Command strips to secure the IMU to the battery pack so it wouldn't rattle around during the ride. You can use any fastener you want of course! The whole stack sits on top of the battery, connected by a short USB-C cable.
First, attach the velcro. Then connect the USB cable to the Arduino and the battery.
Here's where it gets interesting. RollerCoaster Tycoon's rating system isn't random, it's a deterministic function of physical ride properties. Chris Sawyer's original code takes things like maximum G-forces, number of drops, airtime, speed, and inversions, and maps them to Excitement, Intensity, and Nausea scores.
Thanks to a dataset compiled by Nolan Conaway (available on GitHub and Kaggle), we have those input features and output scores for 189 coaster designs from the game. That's our training data.
Choosing Reliable FeaturesThe RCT2 dataset has 11 ride features, but an IMU can't measure all of them equally well. This is the most important design decision in the project: which features do we actually trust?
An accelerometer gives you acceleration directly. It doesn't give you speed. To get speed, you'd have to integrate acceleration over time, and that integral drifts badly. In testing, a 4-minute coaster ride produced speed estimates of 512 mph. Integrating again for distance is even worse. Counting drops, estimating drop heights, and tracking inversions all require either arbitrary threshold tuning or gyroscope integration that accumulates error.
So we narrowed the feature set to five things the IMU can measure without any integration or estimation:
- Max positive vertical G's: the hardest you're pushed into your seat. Direct accelerometer peak. Perfectly reliable.
- Max negative vertical G's: the most weightless you feel. Same — direct accelerometer reading.
- Max lateral G's: the hardest a turn throws you sideways. Direct reading.
- Total airtime: seconds spent in near-weightlessness (vertical G below 0.5). It's just a threshold on a direct reading multiplied by the sample rate. No integration.
- Ride time: how long the ride lasts. A clock. Can't get this wrong.
Everything else- speed, distance, drop count, drop height, and inversions got cut. This had a nice side effect: the original 11-feature dataset had 42 rows with missing inversion data that we had to drop. With only 5 features, all 189 rows are usable. More training data from fewer, better features.
Preparing the DataA Python script cleans the raw CSV and outputs three files with one per target score formatted for Edge Impulse's CSV Wizard. Each file has the five feature columns plus a label column containing the numeric score (excitement, intensity, or nausea). One gotcha: the intensity dataset has a single outlier at 44.94 when everything else is under 10, presumably a deliberately terrible coaster design. The script removes it automatically, because a single extreme outlier will completely wreck a regression model trained on 189 samples.
Here's the script:
#!/usr/bin/env python3
"""
Prepare the nolanbconaway RCT2 dataset for Edge Impulse tabular regression.

This script takes the raw rollercoasters.csv from:
  https://github.com/nolanbconaway/RollerCoaster-Tycoon-Data

And outputs THREE cleaned CSVs ready for Edge Impulse CSV Wizard import,
one per target variable (excitement, intensity, nausea).

We deliberately use only 5 of the dataset's 11 ride features: the ones an
IMU can measure reliably without drift or estimation. Features like speed,
ride length, drop count, drop height, and inversions all require integrating
acceleration (which drifts), counting threshold crossings (which is noisy),
or tracking full rotations (which needs careful sensor fusion). The five
features we keep — three G-force peaks, total airtime, and ride duration —
come directly from the accelerometer and a clock, with no integration or
estimation required.

Usage:
  1. Download rollercoasters.csv from the GitHub repo above
  2. Run: python prepare_rct_for_edge_impulse.py
  3. In Edge Impulse Studio, go to Data Acquisition > CSV Wizard
  4. Upload one of the output CSVs (start with excitement)
  5. Configure the wizard:
     - Delimiter: comma
     - Label column: "label"
     - All other columns: values/features
     - "Does each row represent a single data sample?" -> Yes
  6. After wizard is configured, upload the CSV via the Studio Uploader
  7. Repeat for intensity and nausea
"""

import csv
import sys
import os

INPUT_FILE = "rollercoasters.csv"

# Only the features an IMU can reliably measure:
#
# max_pos_gs       - Peak positive vertical G-force (pushed into seat)
#                    Direct accelerometer reading, no processing needed.
#
# max_neg_gs       - Peak negative vertical G-force (weightlessness)
#                    Direct accelerometer reading.
#
# max_lateral_gs   - Peak lateral G-force (turns)
#                    Direct accelerometer reading.
#
# total_air_time   - Seconds spent in near-weightlessness (vertical G < 0.5)
#                    Threshold on a direct reading x sample rate. Reliable.
#
# ride_time        - Total ride duration in seconds.
#                    Just a clock. Perfectly accurate.
#
# EXCLUDED (unreliable from IMU alone):
#
# max_speed        - Requires integrating acceleration. Drifts within seconds.
# avg_speed        - Same problem.
# ride_length      - Requires double-integrating acceleration. Even worse drift.
# drops            - Requires counting threshold crossings. Sensitive to tuning.
# highest_drop_height - Requires estimating free-fall duration. Noisy.
# inversions       - Requires tracking 360 degree rotations via gyro integration.
#                    Feasible but needs careful sensor fusion we don't have yet.

FEATURE_COLUMNS = [
    "max_pos_gs",
    "max_neg_gs",
    "max_lateral_gs",
    "total_air_time",
    "ride_time",
]

TARGET_COLUMNS = ["excitement", "intensity", "nausea"]


def load_and_clean(input_path):
    """Load the CSV, clean missing values, return list of dicts."""
    with open(input_path, "r") as f:
        reader = csv.DictReader(f)
        rows = list(reader)

    cleaned = []
    skipped = 0
    for row in rows:
        skip = False
        clean_row = {}

        for col in FEATURE_COLUMNS:
            val = row.get(col, "").strip()
            if val == "" or val == "-1":
                skip = True
                break
            try:
                clean_row[col] = float(val)
            except ValueError:
                skip = True
                break

        if skip:
            skipped += 1
            continue

        for col in TARGET_COLUMNS:
            val = row.get(col, "").strip()
            if val == "":
                skip = True
                break
            try:
                clean_row[col] = float(val)
            except ValueError:
                skip = True
                break

        if skip:
            skipped += 1
            continue

        cleaned.append(clean_row)

    print(f"Loaded {len(rows)} rows, kept {len(cleaned)}, skipped {skipped}")
    return cleaned


def write_single_target_csv(rows, target_col, output_path):
    """Write a CSV with features + one 'label' column for regression."""
    header = FEATURE_COLUMNS + ["label"]

    # Filter out the intensity outlier (44.94) if applicable
    filtered = rows
    if target_col == "intensity":
        filtered = [r for r in rows if r[target_col] < 20]
        if len(filtered) < len(rows):
            print(f"  Removed {len(rows) - len(filtered)} intensity outlier(s)")

    with open(output_path, "w", newline="") as f:
        writer = csv.writer(f)
        writer.writerow(header)
        for row in filtered:
            values = [row[col] for col in FEATURE_COLUMNS] + [row[target_col]]
            writer.writerow(values)

    print(f"  Wrote {output_path} ({len(filtered)} samples, target={target_col})")


def print_summary_stats(rows):
    """Print basic stats to sanity-check the data."""
    print("\n--- Feature Summary ---")
    for col in FEATURE_COLUMNS:
        vals = [r[col] for r in rows]
        print(f"  {col:25s}  min={min(vals):8.2f}  max={max(vals):8.2f}  "
              f"mean={sum(vals)/len(vals):8.2f}")

    print("\n--- Target Summary ---")
    for col in TARGET_COLUMNS:
        vals = [r[col] for r in rows]
        print(f"  {col:25s}  min={min(vals):8.2f}  max={max(vals):8.2f}  "
              f"mean={sum(vals)/len(vals):8.2f}")


def main():
    if not os.path.exists(INPUT_FILE):
        print(f"Error: {INPUT_FILE} not found in current directory.")
        print(f"Download it from:")
        print(f"  https://github.com/nolanbconaway/RollerCoaster-Tycoon-Data")
        print(f"Place rollercoasters.csv in this directory and re-run.")
        sys.exit(1)

    rows = load_and_clean(INPUT_FILE)

    if len(rows) == 0:
        print("Error: No valid rows found after cleaning.")
        sys.exit(1)

    print_summary_stats(rows)

    print("\n--- Writing output files ---")

    for target in TARGET_COLUMNS:
        output = f"rct5_{target}.csv"
        write_single_target_csv(rows, target, output)

    print("\n--- Next Steps ---")
    print("1. Go to Edge Impulse Studio > Data Acquisition > CSV Wizard")
    print("2. Upload rct5_excitement.csv (or intensity/nausea)")
    print("3. Configure:")
    print("   - Label column: 'label'")
    print("   - All other columns: values/features")
    print("   - Each row = one sample")
    print("4. Generate features (Average only + StandardScaler), then train")
    print("")
    print("Note: Intensity outlier (~44.94) is automatically removed.")


if __name__ == "__main__":
main()I created three separate Edge Impulse projects (one for excitement, one for intensity, one for nausea) since Edge Impulse's regression block takes a single numeric label per sample.
The workflow for each was identical:
- Upload the CSV via the CSV Wizard (not the regular uploader, that expects time-series data with timestamps)
- Create an impulse with a Flatten processing block and a Regression learning block
- In the Flatten block, uncheck everything except Average (since each "axis" is already a single value, not a time series) and enable StandardScaler normalization
- Train with a 36→16 neuron architecture for 300 cycles
A few things worth explaining for anyone following along:
Why Flatten with only Average? The Flatten block is designed for time-series data and it computes statistics (mean, min, max, RMS, standard deviation, skewness, kurtosis) over a window of samples. But our data is already tabular: each row is a single set of pre-computed values, not a time series. Computing "the average of max_speed" when max_speed is a single number just gives you... that number. So we check only Average, which acts as a pass-through. Without this, the first training run had 35 input features (5 axes × 7 stats) which were mostly redundant copies and zeros.
Why StandardScaler normalization? Our features have very different scales. Ride time goes up to 186 seconds while max_lateral_gs tops out at 3.32. Without normalization, the network's gradient updates are dominated by whichever feature has the largest magnitude. StandardScaler puts everything on equal footing (mean=0, standard deviation=1). The difference was dramatic: our first excitement model without normalization had a loss of 8.32 and was worse than guessing the mean. With normalization, it dropped to 0.92.
Why 36→16 neurons? With only 5 input features and 189 samples, the network needs to be small to avoid memorizing the data. The 36-neuron first layer gives enough capacity to learn feature interactions (like "high lateral Gs combined with long ride time predicts high excitement"), and the 16-neuron second layer compresses those interactions toward the single output.
Why 0.001 for nausea? Nausea was the hardest target to learn. Its validation loss kept climbing while training loss dropped (classic overfitting) at the default 0.005 learning rate. Slowing the learning rate to 0.001 helped it converge without overshooting. Nausea in the original game correlates strongly with lateral Gs and inversions, and since we dropped inversions, the model has less signal to work with.
ResultsAfter training, the three models performed as follows:
- Excitement: MAE 0.71, explained variance 0.34
- Intensity: MAE 0.96, explained variance 0.22
- Nausea: MAE 1.06, explained variance -0.57
An MAE under 1 means the prediction is typically within 1 point on a 0-10 scale. Excitement and intensity are solid. Nausea is the weakest but it still differentiates between rides in practice.
Each model was built for Linux (AARCH64 with Qualcomm QNN) and the resulting.eim files are tiny: 1ms inference time, 1.2K RAM, 10.8K flash. Running all three models simultaneously on the UNO Q is essentially free.
Clamping Real-World DataOne thing I discovered at the park: real coasters produce more extreme values than the RCT2 game data. A ride called Monster hit 6.71 vertical Gs and 41 seconds of airtime- well beyond the training data's maximums of 6.26g and 13.68 seconds. Without guardrails, the model extrapolated wildly and predicted scores above 20.
The fix is simple: clamp each input feature to the range seen in training data before running inference. This means a ride that exceeds the game's physics effectively maxes out that feature. The scores lose some ability to differentiate between extremely intense rides, but they stay on the 0-10 scale and the ranking between rides remains sensible.
In Roller Coaster Tycoon only very few people have gotten excitement values over 10, for example, so this is a reasonable way to map the game's scores onto real coasters.
Building the AppThe app runs in Arduino App Lab using three components. If you imported the ZIP from the Arduino Project Hub, all of this is already in place, this section explains how the pieces fit together.
The Sketch (STM32 Side)The Arduino sketch runs on the STM32 microcontroller and handles real-time IMU sampling. It reads the ICM-20948 over I2C at 200Hz, configured for ±8G acceleration (coasters can pull 5-6G) and ±1000°/s gyro. Samples are batched 10 at a time and sent across the Bridge to reduce RPC overhead.
Recording is controlled from the Python side. The sketch idles until it receives a set_recording(true) call, then starts streaming data.
This is the brain of the operation. It receives IMU data from the sketch via Bridge callbacks, runs signal processing to extract the 5 features, feeds them into the three .eim models, and serves the WebUI and API endpoints.
The signal processing is the most interesting part. The first ~20 samples (recorded while the rider is standing still) establish a gravity calibration vector. Every subsequent sample is projected onto this vector to determine vertical and lateral acceleration, regardless of how the IMU sits in the fanny pack. This means you don't need to worry about mounting orientation, just toss it in and go.
From the calibrated data, the code extracts the five features: peak vertical and lateral Gs (direct from the accelerometer), airtime (periods where vertical G drops below 0.5), and ride duration.
There's also a minimum-motion threshold: if the maximum G-force never exceeds 1.5 and the ride is under 30 seconds, the app tells you there wasn't enough ride data instead of giving you scores for sitting still. I learned this the hard way when the first working version happily rated a stationary desk at 6.21 Excitement.
The WebUIThe interface is a love letter to RCT's UI. the game's signature brown-red color palette, beveled window borders, and the layout of the ride stats window from the game. The three ratings are shown both as text with labels (e.g., "8.51 (Very High)") and as animated meter bars.
The Share button uses html2canvas to screenshot the results panel and save it so you can share it on your favorite social media sites.
Taking It to the ParkIn App Lab, enable the Autostart toggle for the app so it launches on boot. Then set the hotspot to auto-connect. The UNO Q runs its own WiFi hotspot- no phone tethering or router needed. One command sets it up:
sudo nmcli dev wifi hotspot ifname wlan0 ssid "RCT-IRL" password "coaster123"Your phone connects to the "RCT-IRL" network, and you browse to http://10.42.0.1:7000. Add it to your home screen and it launches full-screen like a native app.
With a systemd service for auto-start and the hotspot set to auto-connect on boot, the park workflow is:
- Plug in the battery
- Wait 60 seconds
- Connect your phone to "RCT-IRL" WiFi
- Open the bookmark
- Hit the Start button in the queue, stand still for 2-3 seconds to calibrate
- Ride the coaster
- Hit Stop on the app before you start walking or climbing stairs
- View and share your scores
I took the rig to Adventureland and rode three coasters. Here's what the models thought:
Monster: Excitement 8.51, Intensity 10.00, Nausea 6.20. The most intense ride of the day and my definite favorite!
Outlaw: Excitement 9.01, Intensity 10.00, Nausea 5.64. The highest lateral Gs of any ride at 5.18g- you feel every turn. Slightly higher excitement than Monster, with comparable intensity but less nausea.
Tornado: Excitement 10.00, Intensity 9.32, Nausea 5.64. Maxed out excitement despite having the lowest positive Gs (2.43) but it had the strongest negative Gs (-2.17) and a marathon 5-minute ride time. A classic!
The models differentiate meaningfully between rides: Monster is the most physically intense, Outlaw has the best balance of excitement and intensity, and Tornado wins on pure excitement through sustained airtime and negative Gs.
What's NextMore coaster trips... for research of course! Like any data-driven project like this, more data will improve the models and produce better results. Something interesting to try is to compare the scores of real coasters that appear in Roller Coaster Tycoon (Alton Towers, the Six Flags parks from RCT2, etc.) with their in-game counterparts.
Source Code & Downloads- Arduino Project Hub (ready-to-import ZIP): RollerCoasterTestMeter
- RCT2 Dataset: nolanbconaway/RollerCoaster-Tycoon-Data on GitHub
- Inspiration: RollerCoaster Tycoon by Chris Sawyer, the best game ever made


_3u05Tpwasz.png?auto=compress%2Cformat&w=40&h=40&fit=fillmax&bg=fff&dpr=2)


Comments