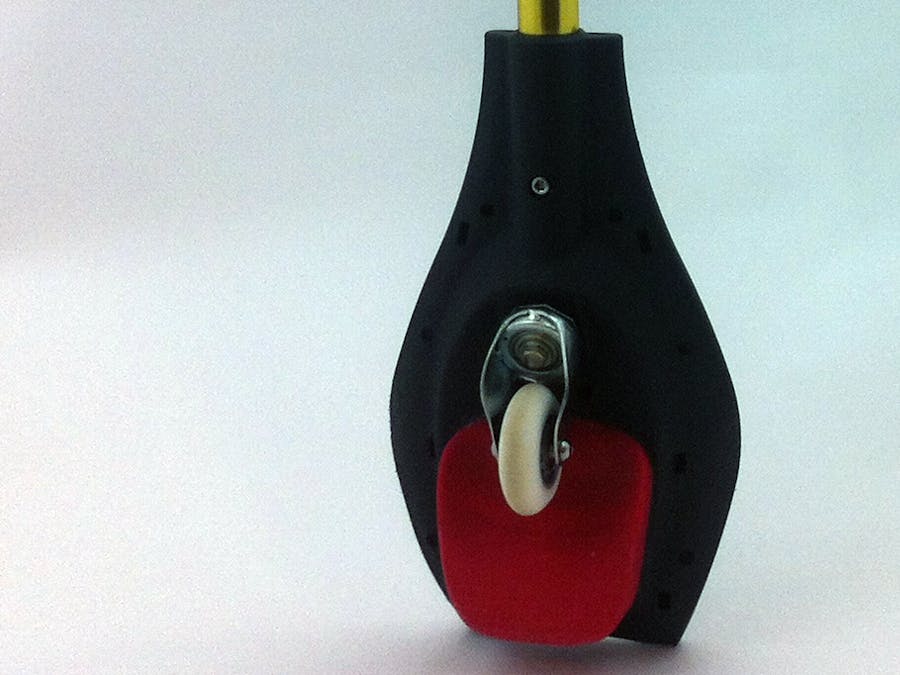
Meet Jack
Jack is a waveboard you share with your friends. Jack prefers to be social and spontaneous, likes trying new things. When he's bored or lonely, he lets you know. He posts his location and movement to a web application, so your friends can come pick him up and ride away with him.
Video Demo
Web Application
Location
Jack uses the web application to report on his whereabouts.
Activity Level
Jack also likes to let his friends know whether he's occupied. The constantly shifting waves in the background of the web application reflect Jack's current activity level.
If he's still, they'll look something like this:
If he's moving around a bit more, they might look like this:
The web application's audio also reflects changes in Jack's activity level. The mysterious sound reflects and ramps up the tension of trying to track down Jack and steal him from other players. When Jack is on the move --- when his acceleration increases --- the pitch rises, and you'd better get going if you want to catch him!
You can download a screen recording of the web application with audio below. Online video hosting services process and compress video files in a way that grossly distorts Jack's unique sound, so this is only available as a direct download.
Expressing Himself
When Jack is getting to run around and cover a lot of ground, he's happy, and he lets you know.
When he's been stuck in one place, Jack gets bored and starts asking friends to come pick him up.
Getaway Button
After stealing Jack away from another user, a user may need time to make a getaway. In this situation he or she can use the "Getaway Repreive" button in the web application, which will bring up a login screen. After a successful login, the server will completely stop serving sensor data for a predefined window of time, so that other users (like perhaps a vengeful recent loser of Jack, hot on the new user's heels in pursuit) will not be able to use the web application to locate Jack during the getaway period. The login is required to prevent users from abusing the system by pressing the getaway button all the time to prevent other users from ever finding Jack.
The Story
For a closer look at Jack's story, you might want to see the slide deck:
Instructables!
The process for making Jack is simple:
1) Borrow, buy, or commandeer a Waveboard.
2) Download and print the STL file below for the chassis. This is where the Arduino and power source will sit.
3) Carefully open the Waveboard from the top. Use a dremel to hollow out a section of the inside, being careful to leave as much supporting material as possible while yet creating room for the requisite electronics.
4) Cut through bottom such that the 3D printed chassis fits snugly against body of Waveboard.
5) Drill a small hole through both the supporting material of the Waveboard and the chassis. Insert machine screw and tighten.
6) Hot-glue around chassis to secure.
7) Follow these directions for connecting your accelerometer: https://learn.adafruit.com/adafruit-analog-accelerometer-breakouts/wiring.
8) Follow these directions for connecting your GPS component: https://learn.adafruit.com/adafruit-ultimate-gps/arduino-wiring.
9) Also attach the battery of your choosing.
10) Download the arduino file and the python file included in the Source Code section above, to use on the arduino. In the arduino file, search for “TODO: choose server location” and change the associated line to indicate the server location of your choosing.
11) From the open top of the waveboard, insert the electronics with code pre-loaded. Be careful, for by this point your Waveboard will have gained sentience.
12) Replace the top of the waveboard.
13) Clone our github repository: github.com/schasins/waveboard.
14) Grep for “TODO: choose server location” in the repository directory and change the associated lines to indicate the server location of your choosing.
15) Follow the directions in repository’s README to start the node server.
16) Direct your browser to the server location of your choosing, and see what Jack has to say.
17) Say hello to Jack! Ride safely and responsibly.
Ideation
Our ideation process encompassed everything from wild and largely unstructured discussions to highly goal-directed brainstorming. During the early stages we touched on some of the ideas around Jack without seeing a fully formed concept emerge.


Comments