


Hardware components | ||||||
 |
| × | 1 | |||
 |
| × | 1 | |||
The idea of a visualizer is simple: take an audio file, play it through headphones or a speaker, and represent the frequency spectrum visually. The result is a mesmerizing lightshow that corresponds to the music being played.
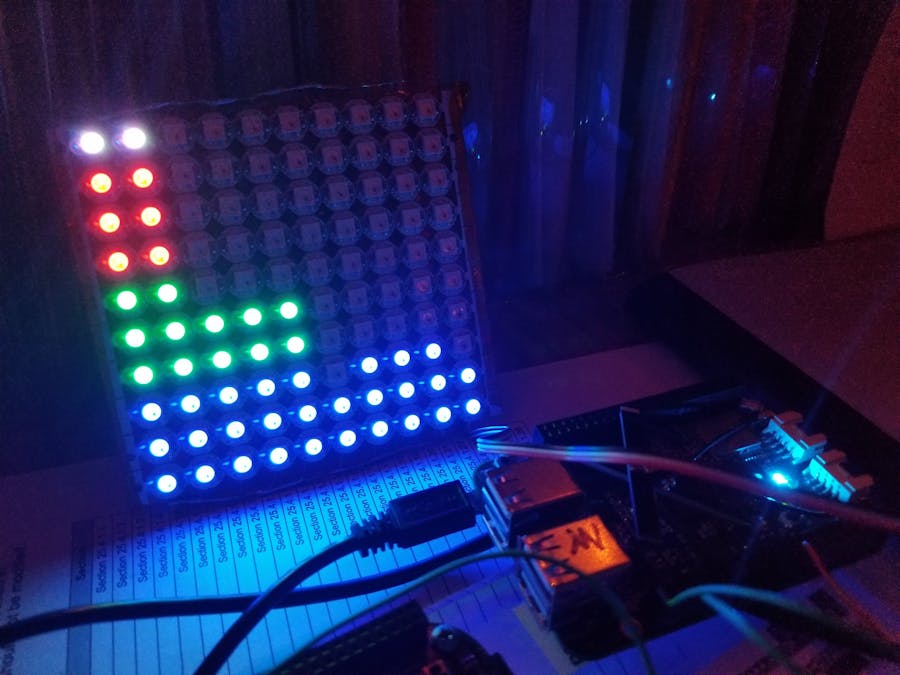
For our project, we used a Beaglebone Green Wireless to run the programs and interface with the devices. Our code was also created for and tested on a 10x10 WS2812b dot matrix, but the visualizer code can be extrapolated to work with other WS2812 LED strips of differing dimensions. With a little tweaking in the config files, any bluetooth speaker should be able to work with this project.
Currently, we have a script that plays .mp3 and .wav audio files. We have another script that converts .mp3 files to .wav files. Our visualizer code takes in a wav file, plays the audio through a bluetooth speaker, and has the WS2812 matrix show ten averaged intensities across a spectrum of frequencies ranging from 0 to 5kHz.
We'd like to add several features, or at least suggest some ideas for future additions. First of all, we'd like to look into making the visualizer code compatible with file formats other than .wav. We'd also like to make the visualizer a little more programmable; in particular, being able to control the frequencies being displayed would be ideal. We also like the idea of being able to select different visualization patterns. Our current visualization pattern splits the frequency range into ten groupings (for ten LEDs), then takes the frequency with the largest intensity and lights up all the LEDs for that column. Each of the other frequency intensities are normalized compared to that one, which means there's always one frequency that's at a "maximum" intensity.

Comments