

Hardware components | ||||||
 |
| × | 1 | |||
| × | 1 | ||||
| × | 1 | ||||
 |
| × | 1 | |||
| × | 1 | ||||
| × | 1 | ||||
| × | 1 | ||||
The Micro:bit is an ARM-based embedded system designed by the BBC for use in computer education in the UK, But it is currently available in other countries of the world.
The board is 4 cm × 5 cm and has an ARM Cortex-M0 processor, accelerometer and magnetometer sensors, Bluetooth and USB connectivity, a display consisting of 25 LEDs, two programmable buttons, and can be powered by either USB or an external battery pack. The device inputs and outputs are through five ring connectors that are part of the 23-pin edge connector.
The Micro:bit was designed to encourage children to get actively involved in writing software for computers and building new things, rather than being consumers of media.
In this tutorial, we'll build a Temperature Data Logger with BBC micro:bit. A temperature data logger, is a portable measurement instrument that is capable of autonomously recording temperature over a defined period of time. The digital data can be retrieved, viewed and evaluated after it has been recorded. Therefore, for this purpose, it is necessary to connect a Real time clock, a temperature sensor and a OpenLog data logger to the micro:bit.
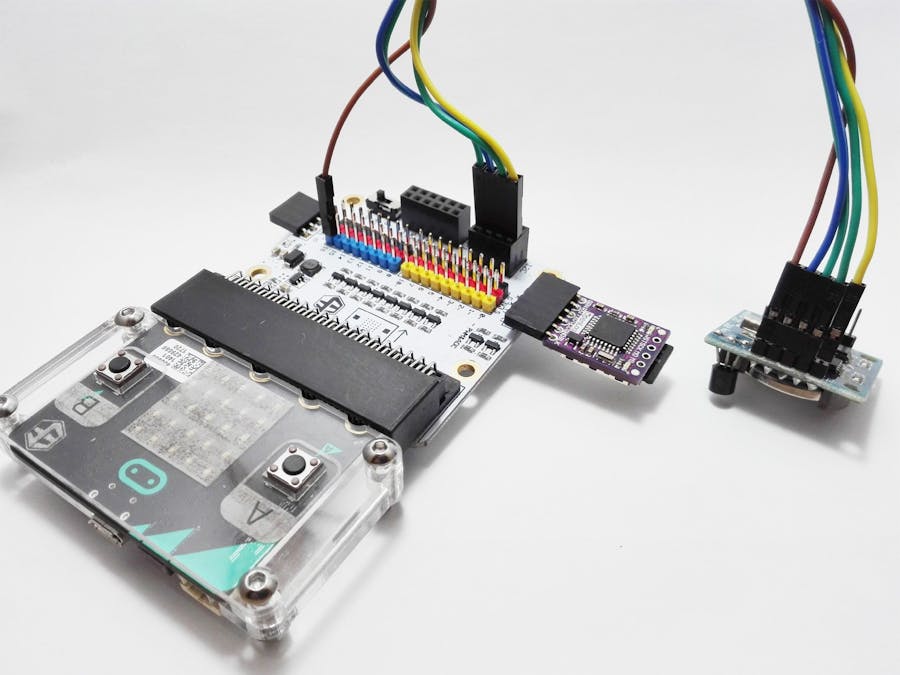
To connect the Real-time Clock, DS18B20 Digital Temperature and OpenLog to the Micro:bit, it requires an interface, In this tutorial, we use Elecfreaks Micro:bit Breakout Board.
ELECFREAKS Octopus:bit is a kind of breakout boards for micro:bit. It can lead out GPIO port, serial port, I2C port, and SPI port on the micro:bit board. The biggest feature of Octopus:bit is that it can switch electric level for some GPIO ports, which makes micro:bit available to be adapted to 5V sensors.
- Input voltage: 3.3V (powered by the edge connector of micro:bit)
- Extend all of GPIO ports (P0~P16, P19~P20).
- Beneath each I/O port, there are pins for VCC and GND. These pins are differentiated by different colors, which enable you to connect your extension module easily. The spread of pins is fully compatible with Octopus series' products.
- With a voltage boosting module, you can shift the working voltage of P8, P9, P11~P16 between 3.3V and 5V through the voltage switch.
- When the voltage switch is at the end of 3.3V, the max current of octopus:bit depends on its power method. When powered by USB port, the output current is 90mA; when powered by PH2.0 battery port, the output current depends on the battery power ability.
- When the voltage switch is at the end of 5V, the maximum output current of 5V part is 500mA.
- Lead out serial port, I2C port and SPI port, among which I2C can connect 3 channels of I2C devices and SPI can connect 2 channels of SPI devices.
- Available for direct serial port communication between two breakout boards.
For more information, visit the Elecfreaks site.
Preparing parts1. Real Time Clock and Temperature Sensor
The clock module is used to record the temperature reading time. For convenience, I used this module, which also has the ability to install a temperature sensor. You can also use any other similar module. Just have a DS18B20 temperature sensor installed in place.
The i2c pin of clock module connects to i2c pin of the Breakout Boardand DS pin connects to GPIO 16 (or any other custom pins) of the Breakout Board as shown in the image below, also change the voltage level to 5 volts via the voltage switch:
2. OpenLog
The OpenLog Data Logger is a simple-to-use open source solution for logging serial data from your projects. The OpenLog provides a simple serial interface to log data from a project to a microSD card.
The primary interface with the OpenLog is the FTDI header on the board edge. This header is designed to plug directly into the Elecfreaks Octopus:bit carrier board’s serial port, which allows the micro:bit to send data over a serial connection to the OpenLog. In this tutorial, I used the Chinese version and cheaper, you can buy it from here.
First thing is that you need to insert a microSD card into the OpenLog with the text side “up” as shown in the image below, Make sure the card “clicks” into place and stays in place.
The OpenLog connects to the Elecfreaks Octopus:bit as shown in the image below :
In the coding section, I used Arduino IDE to upload the code. You first need to install the required libraries according to the Adafruit tutorial. Then download and install the following libraries:
- The RTClib by Jean-Claude Wippler
To use OpenLog, you need a Software Serial on the micro:bit. But the problem is that there is not yet a Software Serial for micro:bit in the Arduino library. but do not worry, One user has solved this problem. Just download the library from the github and install it on Arduino IDE.(more information)
Now upload the following code on the micro:bit :
#include <OneWire.h>
#include <Wire.h>    // I2C
#include "RTClib.h"  // RTC
#include <SoftwareSerial.h>
SoftwareSerial OpenLog(0, 8); 		// Serial DataLogger
RTC_DS1307 RTC;      				// RTC
#define TimeMin 5					// 5 Minute
#define DelayTime 60000*TimeMin
//OneWire DS18S20, DS18B20, DS1822 Temperature Example
OneWire ds(16);
void setup(void)
{
 OpenLog.begin(9600);
 Wire.begin();
 RTC.begin();
 Serial.begin(9600);
 //RTC.adjust(DateTime(__DATE__, __TIME__));	//Adjust time
}
void loop(void)
{
 byte i;
 byte present = 0;
 byte type_s;
 byte data[12];
 byte addr[8];
 float celsius, fahrenheit;
 if ( !ds.search(addr))
 {
   ds.reset_search();
   delay(250);
   return;
 }
  if (OneWire::crc8(addr, 7) != addr[7])
 {
     Serial.println("CRC is not valid!");
     return;
 }
 Serial.println();
 // the first ROM byte indicates which chip
 switch (addr[0])
 {
   case 0x10:
     type_s = 1;
     break;
   case 0x28:
     type_s = 0;
     break;
   case 0x22:
     type_s = 0;
     break;
   default:
     Serial.println("Device is not a DS18x20 family device.");
     return;
 }
 ds.reset();
 ds.select(addr);
 ds.write(0x44, 1);        // start conversion, with parasite power on at the end
 delay(1000);
 present = ds.reset();
 ds.select(addr);
 ds.write(0xBE);         // Read Scratchpad
 for ( i = 0; i < 9; i++)
 {
   data[i] = ds.read();
 }
 // Convert the data to actual temperature
 int16_t raw = (data[1] << 8) | data[0];
 if (type_s) {
   raw = raw << 3; // 9 bit resolution default
   if (data[7] == 0x10)
   {
     raw = (raw & 0xFFF0) + 12 - data[6];
   }
 }
 else
 {
   byte cfg = (data[4] & 0x60);
   if (cfg == 0x00) raw = raw & ~7;  // 9 bit resolution, 93.75 ms
   else if (cfg == 0x20) raw = raw & ~3; // 10 bit res, 187.5 ms
   else if (cfg == 0x40) raw = raw & ~1; // 11 bit res, 375 ms
 }
 DateTime now = RTC.now();   // time
 show_time_and_date(now);  // time
 celsius = (float)raw / 16.0;
 fahrenheit = celsius * 1.8 + 32.0;
 OpenLog.print(celsius);
 OpenLog.println();
 delay(DelayTime);
}
void show_time_and_date(DateTime datetime){
 // Year/Month/Day
 OpenLog.print(datetime.year(),DEC);
 OpenLog.print("/");
 if(datetime.month() < 10)
 {
	OpenLog.print(0);
 }
 OpenLog.print(datetime.month(),DEC);
 OpenLog.print("/");
 if(datetime.day() < 10)
 {
	OpenLog.print(0);
 }
 OpenLog.print(datetime.day(),DEC);
 OpenLog.print(",");
 // Hour:Minute:Second
 if(datetime.hour() < 10)
 {
	OpenLog.print(0);
 }
 OpenLog.print(datetime.hour(),DEC);
 OpenLog.print(":");
 if(datetime.minute() < 10)
 {
	OpenLog.print(0);
 }
 OpenLog.print(datetime.minute(),DEC);
 OpenLog.print(":");
 if(datetime.second() < 10)
 {
	OpenLog.print(0);
 }
 OpenLog.print(datetime.second(),DEC);
 OpenLog.print(",");
}
This code reads the temperature every 5 minutes (TimeMin Variable) and sends it to the Software serial port, In the end, the data is stored by OpenLog on the microSD, as follows text file. As you can see, our data includes: Date, Time, and Temperature.
2018/04/13,00:47:55,26.56
2018/04/13,00:52:52,27.06
2018/04/13,00:56:21,27.25
2018/04/13,01:01:19,27.37
2018/04/13,01:06:16,27.37
2018/04/13,01:11:14,27.50
2018/04/13,01:16:12,27.56
2018/04/13,01:21:09,27.62
2018/04/13,01:26:07,27.56
2018/04/13,01:31:05,27.56
2018/04/13,01:36:04,27.56
2018/04/13,01:41:03,27.56
2018/04/13,01:46:02,27.56
2018/04/13,01:51:01,27.56
2018/04/13,01:56:01,27.56
2018/04/13,02:01:00,27.56
2018/04/13,02:05:59,27.56
2018/04/13,02:10:58,27.56
2018/04/13,02:15:57,27.62
2018/04/13,02:20:56,27.62
2018/04/13,02:25:56,27.56
2018/04/13,02:30:55,27.62
2018/04/13,02:35:54,27.50
2018/04/13,02:40:53,27.50
2018/04/13,02:45:52,27.50
2018/04/13,02:50:51,27.50
2018/04/13,02:55:51,27.50
2018/04/13,03:00:50,27.44
2018/04/13,03:05:49,27.50
2018/04/13,03:10:48,27.50
2018/04/13,03:15:47,27.50
2018/04/13,03:20:46,27.50
2018/04/13,03:25:45,27.56
2018/04/13,03:28:06,27.50
2018/04/13,03:33:05,27.50
2018/04/13,03:38:04,27.56
2018/04/13,03:43:03,27.56
2018/04/13,03:48:02,27.50
2018/04/13,03:53:02,27.50
2018/04/13,03:58:01,27.50
2018/04/13,04:03:00,27.44
2018/04/13,04:07:59,27.44
2018/04/13,04:12:58,27.44
2018/04/13,04:17:57,27.37
2018/04/13,04:22:57,27.44
2018/04/13,04:27:56,27.44
2018/04/13,04:32:55,27.44
2018/04/13,04:37:54,27.44
2018/04/13,04:42:53,27.44
2018/04/13,04:47:52,27.37
2018/04/13,04:52:51,27.37
2018/04/13,04:57:51,27.37
2018/04/13,05:02:50,27.31
2018/04/13,05:07:49,27.31
2018/04/13,05:12:48,27.25
2018/04/13,05:17:47,27.25
2018/04/13,05:22:46,27.31
2018/04/13,05:27:46,27.31
2018/04/13,05:32:45,27.31
2018/04/13,05:37:44,27.31
2018/04/13,05:42:43,27.25
2018/04/13,05:42:59,27.25
2018/04/13,05:47:58,27.25
2018/04/13,05:52:57,27.25
2018/04/13,05:57:56,27.25
2018/04/13,06:02:56,27.25
2018/04/13,06:07:55,27.19
2018/04/13,06:12:54,27.19
2018/04/13,06:17:53,27.19
2018/04/13,06:22:52,27.12
2018/04/13,06:27:51,27.12
2018/04/13,06:32:51,27.19
2018/04/13,06:37:50,27.19
2018/04/13,06:42:49,27.12
2018/04/13,06:47:48,27.12
2018/04/13,06:52:47,27.12
2018/04/13,06:57:46,27.12
2018/04/13,07:02:46,27.12
2018/04/13,07:07:45,27.12
2018/04/13,07:12:44,27.12
2018/04/13,07:17:43,27.06
2018/04/13,07:22:42,27.06
2018/04/13,07:27:41,27.06
2018/04/13,07:32:35,27.06
2018/04/13,07:37:34,27.06
2018/04/13,07:42:33,27.06
2018/04/13,07:47:32,27.06
2018/04/13,07:52:31,27.06
2018/04/13,07:57:30,27.06
2018/04/13,08:02:30,27.06
2018/04/13,08:06:18,27.00
2018/04/13,08:11:17,27.00
2018/04/13,08:16:16,27.00
2018/04/13,08:21:16,27.00
2018/04/13,08:26:15,27.00
2018/04/13,08:31:14,26.94
2018/04/13,08:36:13,26.94
2018/04/13,08:41:12,26.94
2018/04/13,08:46:11,26.87
2018/04/13,08:51:11,26.87
2018/04/13,08:56:11,26.94
2018/04/13,09:01:10,26.94
2018/04/13,09:06:10,26.94
2018/04/13,09:11:10,26.87
2018/04/13,09:16:10,26.87
2018/04/13,09:21:10,26.94
2018/04/13,09:26:10,27.00
2018/04/13,09:31:10,27.00
2018/04/13,09:36:10,27.00
2018/04/13,09:41:10,27.00
2018/04/13,09:46:10,27.00
2018/04/13,09:51:10,26.94
2018/04/13,09:56:10,26.94
2018/04/13,10:01:10,26.94
2018/04/13,10:06:10,26.94
2018/04/13,10:11:10,26.94
2018/04/13,10:16:09,27.00
2018/04/13,10:21:09,27.00
2018/04/13,10:26:09,27.06
2018/04/13,10:31:09,27.94
2018/04/13,10:36:09,28.12
2018/04/13,10:41:09,28.50
2018/04/13,10:46:09,28.50
In this section we want to display the data stored in the previous section with Microsoft Excel on the graph. To import a text file in Excel, follow these steps (I used Excel 2007)
- Open Microsoft Excel.
- Select the Data tab.
- Click From Text.
- Browse to the text file and select it.
- Click Import. The Text Import Wizard will begin.
- Select Delimited and click Next.
- Uncheck Tab and select Comma.
- Click Next.
- Click Finish.
- Select to save the information in either an existing worksheet or a new worksheet.
- On the Excel toolbar, select File > Save As. A dialog box pops up.
- Type a new name for the file in the File Name text field.
- In the end, we select two columns of temperature and time and select the desired graph.


_3u05Tpwasz.png?auto=compress%2Cformat&w=40&h=40&fit=fillmax&bg=fff&dpr=2)
Comments