


Hardware components | ||||||
| × | 1 | ||||
 |
| × | 1 | |||
| × | 1 | ||||
 |
| × | 1 | |||
Software apps and online services | ||||||
 |
| |||||
 |
| |||||
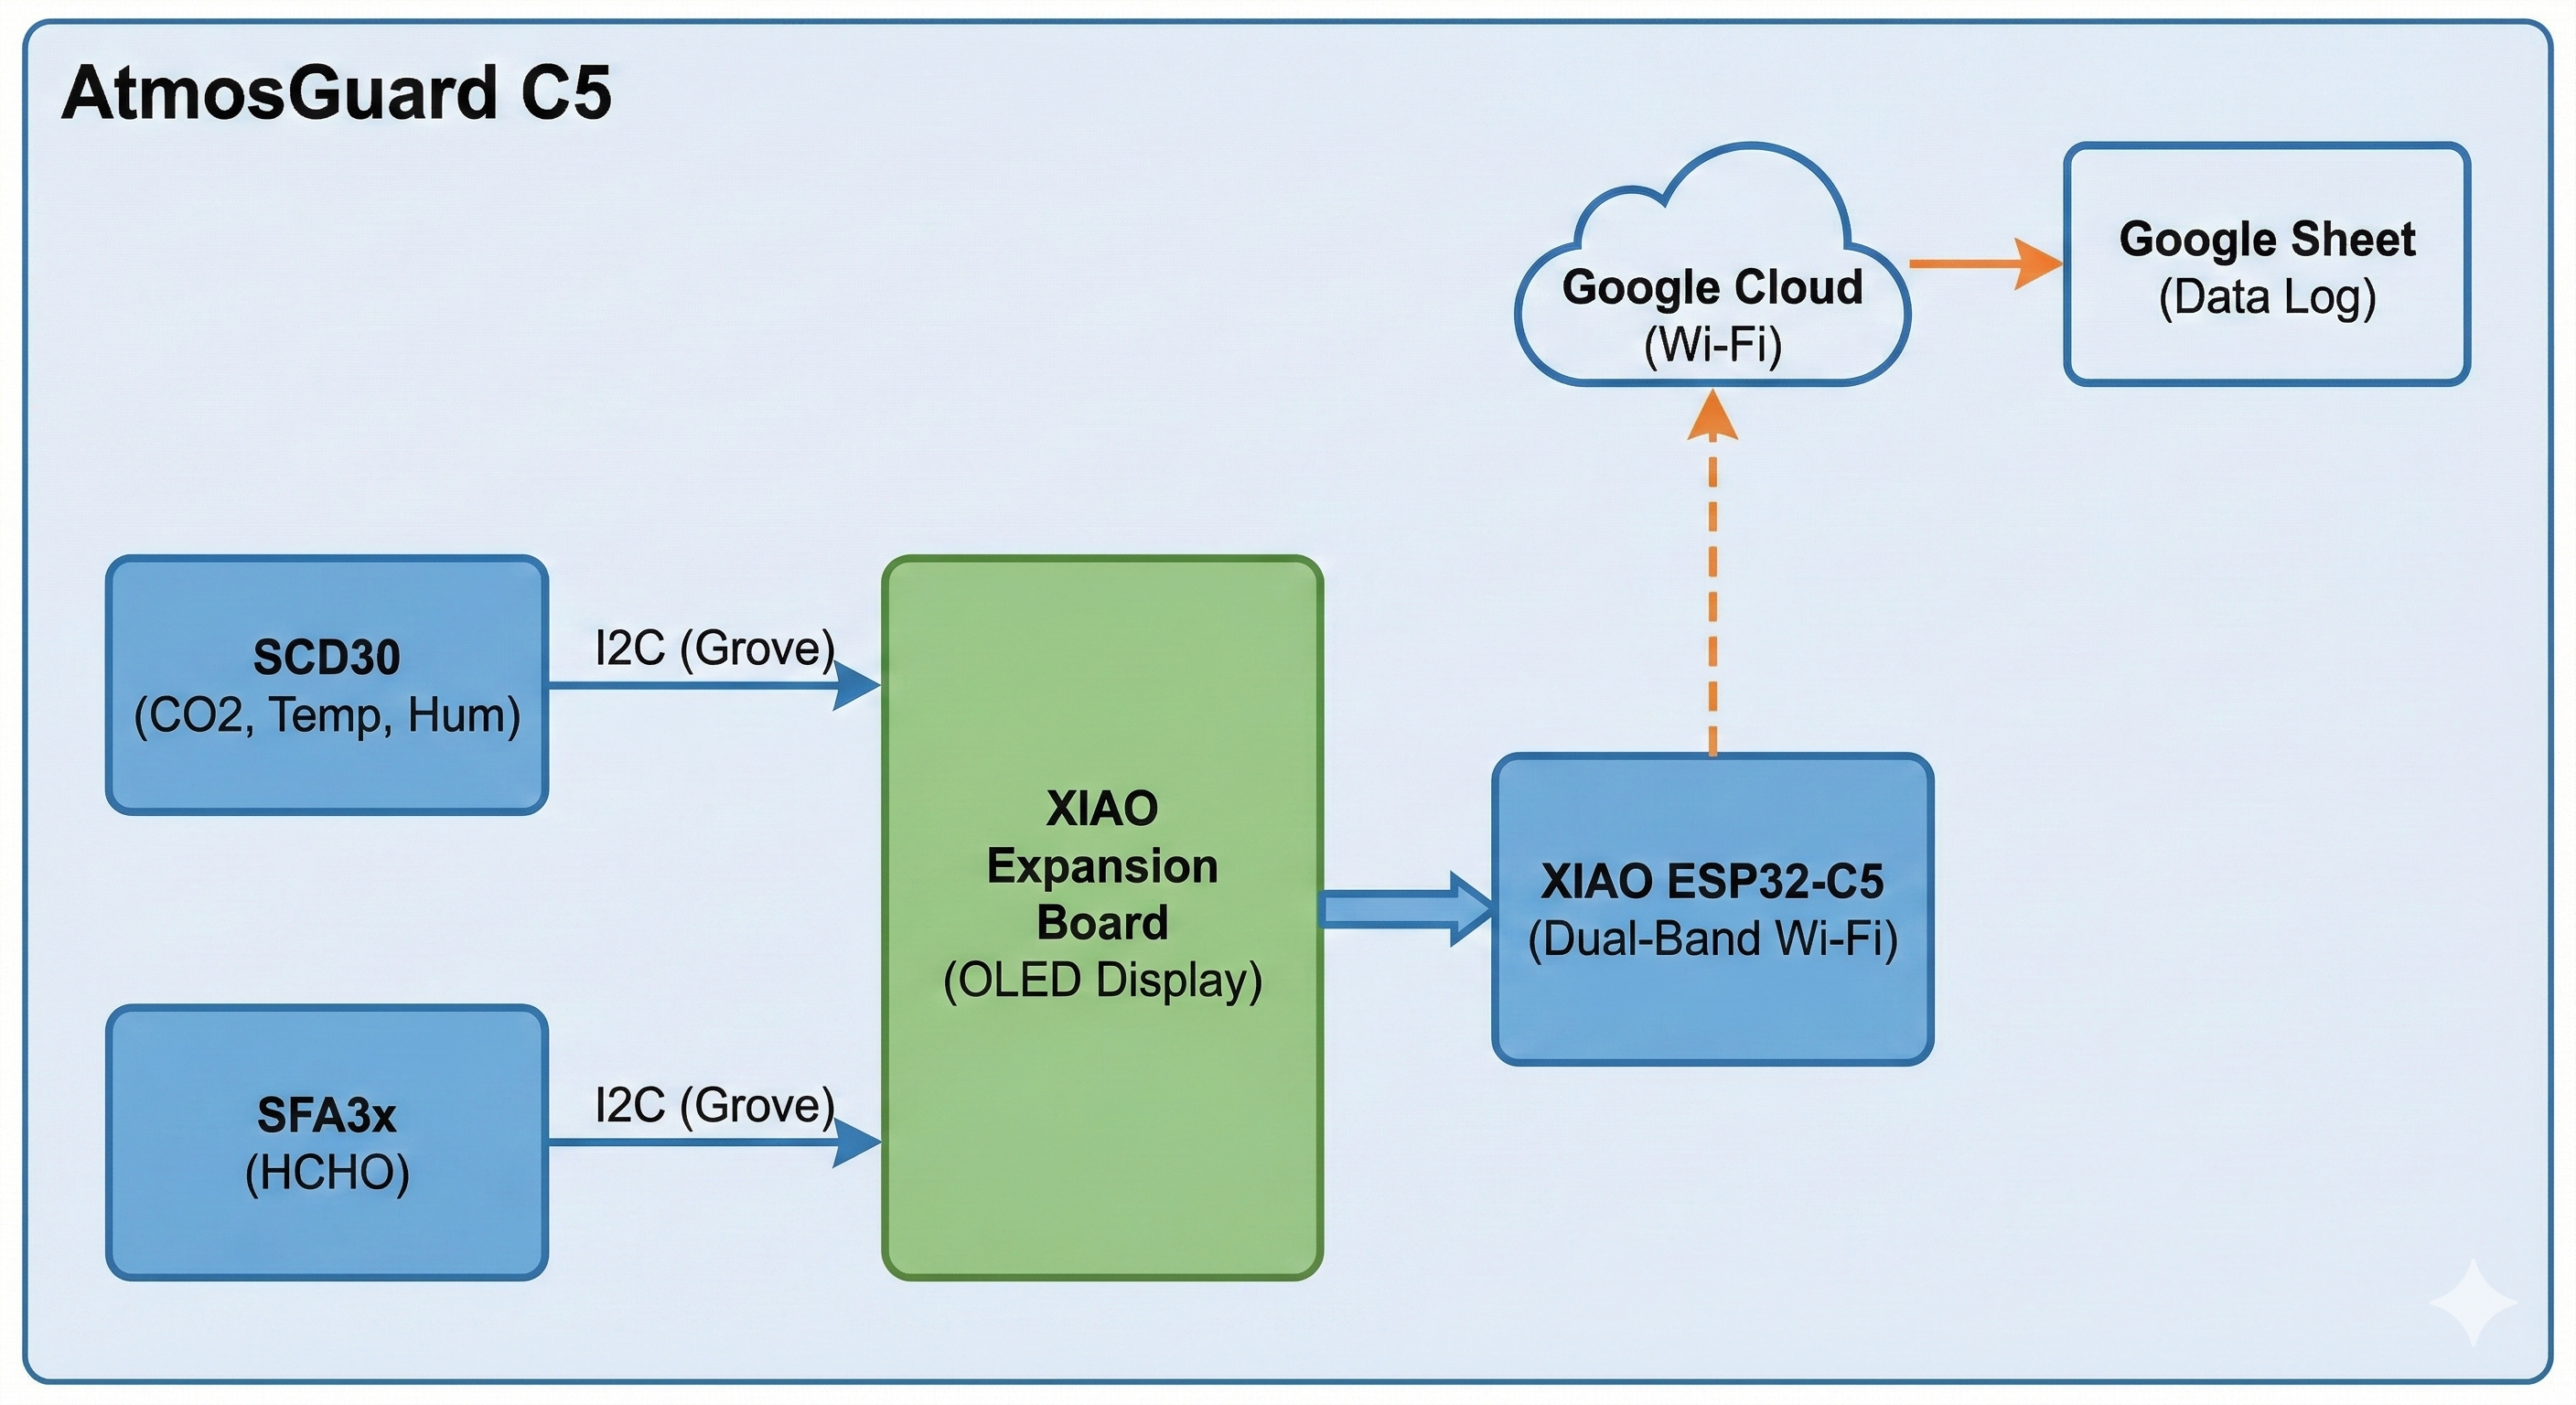
Indoor air quality (IAQ) is often overlooked, yet it directly impacts cognitive function and long-term health. High CO2 levels lead to drowsiness and poor concentration, while Formaldehyde (HCHO)—often emitted from furniture and building materials—is a known irritant. AtmosGuard C5 is a high-precision, connected monitor built on the Seeed Studio XIAO ESP32-C5. It leverages dual-band Wi-Fi to provide real-time monitoring on an OLED display and logs historical data to Google Sheets via a seamless Captive Portal setup.
2. Features- Niche Sensing: Combines NDIR CO2 and Electrochemical HCHO detection for a complete air safety profile.
- Dual-Band Connectivity: Operates on modern 5GHz Wi-Fi networks using the ESP32-C5.
- Captive Portal Configuration: No hardcoded credentials; uses WiFiManager for on-the-go setup.
- Cloud Integration: Real-time data logging to Google Sheets for long-term trend analysis.
- Intelligent Status: Dynamic OLED header updates (GOOD/FAIR/POOR) based on WHO guidelines.
Mount the XIAO: Align the pins of your XIAO ESP32-C5 with the female headers on the XIAO Expansion Board and press down firmly.
SCD30 Connection: Connect one end of a Grove cable to the SCD30 and the other end to any of the available I2C Grove ports on the expansion board.
SFA3x Connection: Connect the second Grove cable to the SFA3x and the remaining I2C Grove port.
Display Setup: Ensure the small switch on the Expansion Board labeled "OLED" is set to the ON position.
Power: Connect a USB-C cable to the XIAO ESP32-C5. Note that the expansion board can also be powered by a 3.7V LiPo battery via the underside JST connector for portability.
Because the SSD1306 OLED, SCD30, and SFA3x all communicate via the I2C protocol, they share the same two data lines (SDA and SCL). The ESP32-C5 distinguishes between them using their unique I2C addresses:
- OLED:
0x3C - SFA3x:
0x5D - SCD30:
0x61
This parallel connection is what makes the system "expandable" without needing more pins.
The code is structured to ensure stability on the new Xiao ESP32-C5 RISC-V core:
- I2C Stability: Initialized at 100kHz after a 2-second boot delay to prevent bus hangs.
- Non-Blocking Logic: Sensor readings are decoupled from the cloud logging interval (60 seconds) to keep the display responsive.
- Persistent Data: Global variables store the "last known good" reading to prevent the display from flickering to zero during sensor warm-up.
- HTTPS Redirects: Specifically configured to follow Google’s server redirects to ensure data reaches the spreadsheet.
Sensors:Adafruit_SCD30.h and SensirionI2cSfa3x.h handle the complex I2C communication protocols for the CO2 and Formaldehyde sensors.Display:U8g2lib.h is used because it supports "Full Buffer" mode, allowing for smoother screen updates and custom fonts.Networking:WiFiManager.h is the key to the Captive Portal. It prevents you from having to hardcode your Wi-Fi password into the script.Cloud:HTTPClient.h allows the ESP32-C5 to act like a web browser to "GET" the Google Script URL.Make sure these library are installed in the Arduino IDE.
C++
Adafruit_SCD30 scd30;
SensirionI2cSfa3x sfa3x;
U8G2_SSD1306_128X64_NONAME_F_HW_I2C u8g2(...);
We create "objects" for the sensors and display here so they can be accessed from both setup() and loop(). We also define lastEntry and interval to manage timing; this ensures we don't spam Google Sheets with too many requests, which could lead to a temporary ban.
This runs once when the device powers on.
- Serial.begin(115200): Starts the communication with your computer for debugging.
- Wire.begin() & Wire.setClock(100000): This is the most critical part for the ESP32-C5. It initializes the I2C bus. We set the speed to 100kHz (Standard Mode) to ensure stability when multiple sensors are sharing the same wires.
- WiFiManager wm: It checks if the device remembers a Wi-Fi network. If not, it starts an Access Point (AP) named "AirMonitor-AP." The
wm.setConfigPortalTimeout(120)is a safety feature; if no one connects to the AP within 2 minutes, the device moves on to local monitoring so it doesn't stay stuck forever.
The loop runs repeatedly and performs three main tasks:
A. Reading Sensor DataC++
if (scd30.dataReady() && scd30.read()) { ... }The SCD30 only updates every 2 seconds. This if statement ensures we only update our variables when the sensor has a fresh reading. This prevents the "zero readings" bug.
We use a simple if-else logic to categorize the air.
- POOR: If CO2 > 1500ppm OR HCHO > 100ppb.
- FAIR: If CO2 > 1000ppm OR HCHO > 60ppb.
- GOOD: Everything else. This logic prioritizes safety; if even one sensor detects bad air, the whole status changes to "POOR."
The u8g2.clearBuffer() clears the "virtual" screen in the ESP32 memory. We then draw our text and lines, and finally call u8g2.sendBuffer() to push that entire image to the physical screen at once. This prevents the "flickering" effect seen in simpler libraries.
C++
http.setFollowRedirects(HTTPC_STRICT_FOLLOW_REDIRECTS);This is the "secret sauce" for Google Sheets. When the Xiao ESP32C5 hits a Google Script URL, Google responds with a 302 Redirect. Without this specific line, the Xiao ESP32C5 would stop at the redirect and the data would never actually reach your spreadsheet. This function packages your CO2, HCHO, Temp, and Hum values into a single URL string and "visits" that link to log the data.
/* * Air Quality Monitor with Google Sheets Logging
 * Hardware: XIAO ESP32-C5 + SCD30 + SFA3x
 * Author: Hendra
 */

#include <Arduino.h>
#include <Wire.h>
#include <Adafruit_SCD30.h>
#include <SensirionI2cSfa3x.h>
#include <U8g2lib.h>
#include <WiFi.h>
#include <HTTPClient.h>
#include <WiFiManager.h>

// PASTE YOUR GOOGLE SCRIPT WEB APP URL HERE
const char* googleScriptURL = "https://script.google.com/macros/s/.../exec";

Adafruit_SCD30 scd30;
SensirionI2cSfa3x sfa3x;
U8G2_SSD1306_128X64_NONAME_F_HW_I2C u8g2(U8G2_R0, /* reset=*/ U8X8_PIN_NONE);

float co2 = 0, temp = 0, hum = 0, hcho = 0;
unsigned long lastEntry = 0;
const long interval = 60000;

void setup() {
    Serial.begin(115200);
    delay(2000);

    // Initialize I2C and OLED
    Wire.begin();
    Wire.setClock(100000);
    u8g2.begin();
    u8g2.clearBuffer();
    u8g2.setFont(u8g2_font_ncenB08_tr);
    u8g2.drawStr(0, 20, "Starting WiFi...");
    u8g2.sendBuffer();

    // Start WiFiManager Captive Portal
    WiFiManager wm;
    wm.setConfigPortalTimeout(120);
    if (!wm.autoConnect("AirMonitor-AP")) {
        u8g2.drawStr(0, 40, "Local Mode Only");
        u8g2.sendBuffer();
        delay(3000);
    }

    // Initialize Sensors
    if (!scd30.begin()) { Serial.println("SCD30 Fail"); }
    sfa3x.begin(Wire, SFA3X_I2C_ADDR_5D);
    sfa3x.startContinuousMeasurement();
}

void sendToSheets(String status) {
    if (WiFi.status() != WL_CONNECTED) return;
    HTTPClient http;
    String url = String(googleScriptURL) + "?co2=" + String(co2) + "&hcho=" + String(hcho) +
                 "&temp=" + String(temp) + "&hum=" + String(hum) + "&status=" + status;

    if (http.begin(url)) {
        http.setFollowRedirects(HTTPC_STRICT_FOLLOW_REDIRECTS);
        int httpCode = http.GET();
        http.end();
    }
}

void loop() {
    if (scd30.dataReady() && scd30.read()) {
        co2 = scd30.CO2;
        temp = scd30.temperature;
        hum = scd30.relative_humidity;
    }
    float s_hum, s_temp;
    sfa3x.readMeasuredValues(hcho, s_hum, s_temp);

    String statusStr = "GOOD";
    if (co2 > 1500 || hcho > 100) statusStr = "POOR";
    else if (co2 > 1000 || hcho > 60) statusStr = "FAIR";

    u8g2.clearBuffer();
    u8g2.setFont(u8g2_font_ncenB10_tr);
    u8g2.drawStr(0, 12, statusStr.c_str());
    u8g2.drawHLine(0, 16, 128);
    u8g2.setFont(u8g2_font_ncenB08_tr);
    u8g2.setCursor(0, 32); u8g2.print("CO2: "); u8g2.print((int)co2);
    u8g2.setCursor(0, 46); u8g2.print("HCHO: "); u8g2.print(hcho, 1);
    u8g2.setCursor(0, 62); u8g2.print("WiFi: "); u8g2.print(WiFi.status() == WL_CONNECTED ? "OK" : "OFF");
    u8g2.sendBuffer();

    if (millis() - lastEntry >= interval) {
        sendToSheets(statusStr);
        lastEntry = millis();
    }
    delay(1000);
}
Setting up the Google Sheets Bridge
To log data, we use a simple Google Apps Script.
Create a new Google Sheet.
Go to Extensions > Apps Script and paste the code below:JavaScript
function doGet(e) {
  var sheet = SpreadsheetApp.getActiveSpreadsheet().getActiveSheet();
  // Append timestamp, CO2, HCHO, Temp, Hum, and Status
  sheet.appendRow([new Date(), e.parameter.co2, e.parameter.hcho, e.parameter.temp, e.parameter.hum, e.parameter.status]);
  return ContentService.createTextOutput("Success");
}
Click Deploy > New Deployment.Select Web App, set access to "Anyone, " and copy the Web App URL. You will paste this into the Arduino code.
then you should the result like below:
Even with a working code, hardware can be finicky. This section covers common hurdles users might face when building this Air Quality Monitor.
1. I2C Bus Conflicts & WiringSince both the SCD30 and SFA3x are on the same I2C bus, they must have different addresses. Fortunately, they do (SCD30 is 0x61, SFA3x is 0x5D).
The "Fail" Message: If you see "SCD30 Fail" or "SFA3x Online" never appearing in the Serial Monitor, check your Grove cables. Ensure they are seated firmly.
Voltage Drop: Long wires can cause signal degradation. If your sensors are more than 20cm away from the XIAO, you might need to lower the I2C speed further to 50000 or add 4.7kΩ pull-up resistors to SDA and SCL.
If your Serial Monitor says "Data Sent" but nothing appears in your sheet, the issue is almost always the Google Deployment.
Fix: You cannot just "Save" the script. You must go to Deploy > Manage Deployments, edit the current one, and select "New Version." Every time you change the script code, a new version must be deployed, or the URL effectively points to "dead" code.
Permissions: Ensure "Who has access" is set to "Anyone"—if it is set to "Myself, " the ESP32 (which isn't logged into your Google account) will be blocked.
3. ESP32-C5 Power StabilityThe SCD30 uses a physical infrared lamp that pulses. This creates a tiny "brownout" spike.
The Symptom: The device reboots exactly every 60 seconds (right when the WiFi turns on to send data).
The Fix: Add a 100µF to 1000µF capacitor across the 5V and GND pins on the expansion board to act as a power reservoir, or use a higher-quality USB cable.
4. Sensirion SFA3x "Initial Burn-in"If your HCHO readings are jumping around wildly during the first 10 minutes, don't worry.
Why: The electrochemical cell in the SFA3x needs to reach chemical equilibrium. For the most accurate data, let the device run for at least 60 minutes before taking "final" screenshots of your data.


Comments