#include <WiFi.h>
#include <WebServer.h>
// #include "DHT.h"
// --- WIFI CONFIGURATION ---
const char* ssid = "***";
const char* password = "***";
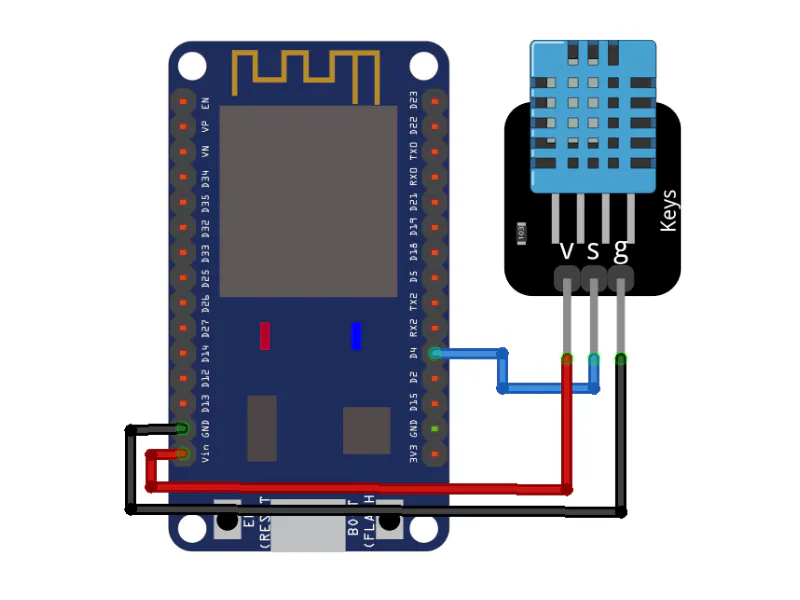
// --- DHT SENSOR CONFIGURATION (TEMPORARILY DISABLED - USING DUMMY DATA) ---
// Adjust to the pin you are using
// #define DHTPIN 4
// Choose DHT type: DHT11, DHT22, or DHT21
// #define DHTTYPE DHT11
// DHT dht(DHTPIN, DHTTYPE);
WebServer server(80);
// --- MAIN HTML PAGE ---
// Web UI will be served directly from ESP32 memory.
// Using ECharts library via CDN to create a modern and attractive Gauge Chart.
const char index_html[] PROGMEM = R"rawliteral(
<!DOCTYPE html>
<html lang="en">
<head>
<meta charset="UTF-8">
<meta name="viewport" content="width=device-width, initial-scale=1.0">
<title>ESP32 Local Monitoring</title>
<!-- ECharts CDN -->
<script src="https://cdn.jsdelivr.net/npm/echarts@5.5.0/dist/echarts.min.js"></script>
<style>
* {
box-sizing: border-box;
margin: 0;
padding: 0;
}
body {
font-family: 'Segoe UI', Tahoma, Geneva, Verdana, sans-serif;
background-color: #121212; /* Dark Mode */
color: #ffffff;
display: flex;
flex-direction: column;
align-items: center;
justify-content: center;
min-height: 100vh;
padding: 20px;
}
h1 {
font-weight: 600;
margin-bottom: 40px;
text-align: center;
letter-spacing: 1px;
text-shadow: 0 2px 4px rgba(0,0,0,0.5);
}
.dashboard {
display: flex;
flex-wrap: wrap;
gap: 30px;
justify-content: center;
width: 100%;
max-width: 900px;
}
.card {
background: #1e1e1e;
border-radius: 16px;
box-shadow: 0 10px 20px rgba(0,0,0,0.3);
padding: 30px;
width: 100%;
max-width: 400px;
height: 380px;
display: flex;
flex-direction: column;
align-items: center;
border: 1px solid #333;
transition: transform 0.3s ease, box-shadow 0.3s ease;
}
.card:hover {
transform: translateY(-5px);
box-shadow: 0 15px 30px rgba(0,0,0,0.5);
}
.gauge-container {
width: 100%;
height: 100%;
}
.status {
margin-top: 20px;
font-size: 14px;
color: #888;
}
#last-update {
font-weight: bold;
color: #bbb;
}
</style>
</head>
<body>
<h1>ESP32 Environment Dashboard</h1>
<div class="dashboard">
<!-- Temperature Card -->
<div class="card">
<div id="tempGauge" class="gauge-container"></div>
</div>
<!-- Humidity Card -->
<div class="card">
<div id="humGauge" class="gauge-container"></div>
</div>
</div>
<div class="status">
Last updated: <span id="last-update">-</span>
</div>
<script>
// ECharts Gauge configuration imitating the "Half - Needle" style from reference
function createGaugeOption(name, min, max, unit, colors) {
return {
series: [
{
type: 'gauge',
center: ['50%', '60%'], // Move it down slightly
radius: '80%', // Adjust so numbers outside aren't cut off
startAngle: 180,
endAngle: 0,
min: min,
max: max,
splitNumber: 4,
itemStyle: {
color: '#ffffff', // Needle color
shadowColor: 'rgba(0,0,0,0.4)',
shadowBlur: 10,
shadowOffsetX: 2,
shadowOffsetY: 2
},
progress: {
show: false // Zone background is handled by axisLine
},
pointer: {
show: true,
icon: 'path://M12.8,0.7l12,40.1H0.7L12.8,0.7z',
length: '75%',
width: 12,
offsetCenter: [0, '0%'] // Place needle base right at the center point
},
axisLine: {
lineStyle: {
width: 35,
color: colors // Zone colors
}
},
axisTick: {
show: false
},
splitLine: {
show: true,
length: 35,
lineStyle: { color: '#1e1e1e', width: 4 } // Black/dark separator lines
},
axisLabel: {
distance: -65, // Larger negative value so it is completely OUTSIDE (above) the color band
color: '#fff',
fontSize: 14,
fontWeight: 'bold'
},
title: {
show: true,
offsetCenter: [0, '55%'], // 'Temperature' text moved far down
fontSize: 20,
color: '#ccc'
},
detail: {
valueAnimation: true,
fontSize: 42,
fontWeight: 'bold',
color: '#fff',
offsetCenter: [0, '25%'], // '25 °C' text moved below the needle pivot point
formatter: '{value}' + unit
},
data: [{ value: 0, name: name }]
}
]
};
}
var tempChart = echarts.init(document.getElementById('tempGauge'));
var humChart = echarts.init(document.getElementById('humGauge'));
// Temperature Color Zones: Green -> Yellow -> Red
var tempColors = [
[0.4, '#58D9F9'], // 0 - 20C (Blue - Cold)
[0.6, '#7CFFB2'], // 20 - 30C (Green - Cool)
[0.8, '#FDDD60'], // 30 - 40C (Yellow - Warm)
[1.0, '#FF6E76'] // 40 - 50C (Red - Hot)
];
// Humidity Color Zones: Red (Dry) -> Green (Normal) -> Blue (Very Humid)
var humColors = [
[0.3, '#FF6E76'], // 0 - 30% (Dry)
[0.7, '#7CFFB2'], // 30 - 70% (Comfortable)
[1.0, '#58D9F9'] // 70 - 100% (Too Humid)
];
tempChart.setOption(createGaugeOption('Temperature', 0, 50, ' °C', tempColors));
humChart.setOption(createGaugeOption('Humidity', 0, 100, ' %', humColors));
function fetchData() {
fetch('/data')
.then(response => response.json())
.then(data => {
tempChart.setOption({
series: [{ data: [{ value: data.temperature, name: 'Temperature' }] }]
});
humChart.setOption({
series: [{ data: [{ value: data.humidity, name: 'Humidity' }] }]
});
// Update clock
const now = new Date();
document.getElementById('last-update').innerText = now.toLocaleTimeString();
})
.catch(error => console.error('Failed to fetch data from ESP32:', error));
}
// Fetch initial data, then repeat every 3 seconds
fetchData();
setInterval(fetchData, 3000);
// Responsive handling
window.addEventListener('resize', function() {
tempChart.resize();
humChart.resize();
});
</script>
</body>
</html>
)rawliteral";
void handleRoot() {
server.send(200, "text/html", index_html);
}
void handleData() {
// --- USING DUMMY DATA ---
// Generate random values for simulation
float h = random(40, 80) + (random(0, 10) / 10.0); // Dummy humidity 40.0 - 80.9
float t = random(25, 35) + (random(0, 10) / 10.0); // Dummy temperature 25.0 - 35.9
// Original sensor code disabled
/*
float h = dht.readHumidity();
float t = dht.readTemperature();
if (isnan(h) || isnan(t)) {
Serial.println("Failed to read from DHT sensor!");
h = 0; t = 0;
}
*/
// Create JSON string manually
String json = "{";
json += "\"temperature\":";
json += String(t, 1); // 1 decimal place
json += ", \"humidity\":";
json += String(h, 1);
json += "}";
// To allow access from local HTML files during testing
server.sendHeader("Access-Control-Allow-Origin", "*");
server.send(200, "application/json", json);
}
void setup() {
Serial.begin(115200);
// Initialize DHT sensor (Disabled)
// dht.begin();
// Start WiFi connection
WiFi.begin(ssid, password);
Serial.print("Connecting to WiFi");
// Wait for connection
while (WiFi.status() != WL_CONNECTED) {
delay(500);
Serial.print(".");
}
Serial.println("\n");
Serial.println("=== WiFi Connected ===");
Serial.print("ESP32 IP Address: ");
Serial.println(WiFi.localIP());
Serial.println("Open this IP Address in your browser!");
Serial.println("======================");
// Endpoint Routing
server.on("/", HTTP_GET, handleRoot);
server.on("/data", HTTP_GET, handleData);
// Start the server
server.begin();
}
void loop() {
// Handle HTTP request
server.handleClient();
// Avoid using long delay() in the loop
// so server.handleClient() is not blocked.
}


Comments