
Hardware components | ||||||
 |
| × | 1 | |||
| × | 1 | ||||
| × | 1 | ||||
| × | 1 | ||||
Software apps and online services | ||||||
 |
| |||||
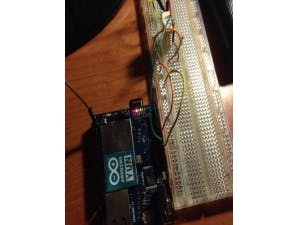
These are the indications of how your prototype must be built.
The main code with all functions and specifically libraries like in the following main comments:
#include "DHT.h"                 //librarie used by the RHT03 sensor
 #include             //function used to communicate with Arduino
 #include       //We call the functions for creating a server
 #include        //to display the data collected.
#define DHTPIN 2                  //We define the number of pin (2 in my case)
 #define DHTTYPE DHT22       //librerie for the  sensor RHT03
#include "DHT.h"                 //librarie used by the RHT03 sensor
#include <Bridge.h>             //function used to communicate with Arduino
#include <YunServer.h>       //We call the functions for creating a server
#include <YunClient.h>        //to display the data collected.
#define DHTPIN 2                  //We define the number of pin (2 in my case)
#define DHTTYPE DHT22       //the type of sensor RHT03
YunServer server;                      //Initialize the global variables that are used for the server and the sensor:
                                                  //The variable "h" will serve to store the humidity reading and "t" for the temperature
DHT dht(DHTPIN, DHTTYPE);
int h, t;
void setup() {
  Bridge.begin();
  server.listenOnLocalhost();
  server.begin();
  dht.begin();
}
void loop() {
  h = dht.readHumidity();
  t = dht.readTemperature();
  YunClient client = server.accept();
  if (client) {
    process(client);
    client.stop();
  }

  delay(50);
}
void process(YunClient client) {

  String command = client.readStringUntil('\r');
  if (command == "termo") {
    temp(client);
  }
  if (command == "idro") {
    idro(client);
  }
}
void temp(YunClient client) {
  if (isnan(t)) {
    client.print(F("Error"));
  } else {
    client.print(t);
  }
}
void idro(YunClient client) {
    if (isnan(t)) {
      client.print(F("Error"));
    } else {
      client.print(h);
    }
}
We must have 3 PHP files, as is written in the Arduino configuration step, this 3 files are memorized in the memory card of Arduino Yun:
- "save.php" measures the temperature and humidity every 50 ms and is waiting for a request from a browser to call the function that processes the command. Creates a program that reads the values of temperature and humidity and saves them to a file on the micro SD card.
- "data.php" - We need to run the program every certain period of time as we want to do this with the following string (every hour in this case):
0 * * * * /usr/bin/php-cgi /mnt/sda1/php/save.php
- To see the result, I created a file "data.php" that reads the file that is created by our save.php every hour and assign values to variables.
<?PHP
$umido = file_get_contents ("http://192.168.1.200/arduino/idro");
$tempe = file_get_contents ("http://192.168.1.200/arduino/termo");
date_default_timezone_set('Europe/Rome');
$save= date ("H:i:s d.m.Y")."|".$umido."|".$tempe."\n";
$write_file = fopen("datilog.txt","a");
fwrite($write_file,$save);
fclose($write_file);
?>
<?PHP
if (isset($_GET['nrv'])) {
	$val = intval($_GET['nrv']);
	if ($val < 1) $val = 10;
	if ($val > 50) $val = 50;
} else {
	$val = 10;
}
if (isset($_GET['pag'])) {
	$pag = intval($_GET['pag'])*$val;
	if ($pag == 0) $pag = 10;
} else {
	$pag = 10;
}
$linee = file("datilog.txt");
foreach($linee as $line)
{
   $nr++;
   if ($nr <= $pag && $nr > $pag-$val-1) $numero++;
   list($dat[$numero],$umi[$numero],$tem[$numero]) = explode("|", $line);
 }
if ($numero > $val) $numero = $val;
$pp = $nr/$val;
if ($pp-intval($pp) != 0) {
	$pp = intval($pp)+1;
} else {
	$pp = intval($pp);
}
if (($pag/$val) > $pp) {
	$pag = $pp*$val;
	echo '<meta http-equiv="refresh" content="0; url=?pag='.($pag/$val).'&nrv='.$val.'">';
}
?>
<!DOCTYPE html>
include ("data.php");
$umido = file_get_contents ("http://localhost/arduino/idro");
$tempe = file_get_contents ("http://localhost/arduino/termo");
?>
<HTML>
<HEAD>
<TITLE> Arduino YUN Pagina <?PHP echo $pag/$val; ?></TITLE>

    <link rel="stylesheet" href="css/style.css" type="text/css" media="screen" />
    <link rel="stylesheet" href="css/print.css" type="text/css" media="print" />

<script type="text/javascript" src="//www.google.com/jsapi"></script>
    <script type="text/javascript">
      google.load('visualization', '1');
    </script>
    <script type="text/javascript">
      function drawVisualization() {
        var wrapper = new google.visualization.ChartWrapper({
          chartType: 'ColumnChart',
          dataTable: [['', <?PHP for($a = 1; $a < $numero; $a++) { echo "'".$dat[$a]."',"; } echo "'".$dat[$numero]."'"; ?> ],
                      ['', <?PHP for($a = 1; $a < $numero; $a++) { echo $tem[$a].","; } echo $tem[$numero]; ?> ]],
          options: {'temperatura': 'data'},
          containerId: 'temperatura'
        });
        wrapper.draw();
      }


      google.setOnLoadCallback(drawVisualization);
    </script>
    <script type="text/javascript">
      google.load('visualization', '1');
    </script>
    <script type="text/javascript">
      function drawVisualization() {
        var wrapper = new google.visualization.ChartWrapper({
          chartType: 'ColumnChart',
          dataTable: [['', <?PHP for($a = 1; $a < $numero; $a++) { echo "'".$dat[$a]."',"; } echo "'".$dat[$numero]."'"; ?> ],
                      ['', <?PHP for($a = 1; $a < $numero; $a++) { echo $umi[$a].","; } echo $umi[$numero]; ?> ]],
          options: {'umidita': 'data'},
          containerId: 'umidita'
        });
        wrapper.draw();
      }


      google.setOnLoadCallback(drawVisualization);
    </script>
<script type='text/javascript'>
      google.load('visualization', '1', {packages:['gauge']});
      google.setOnLoadCallback(drawChart);
      function drawChart() {
        var data = google.visualization.arrayToDataTable([
          ['Label', 'Value'],
          ['C', <?PHP echo $tempe; ?>],
        ]);
        var options = {
          width: 400, height: 120,
          redFrom: 40, redTo: 60,
          yellowFrom:30, yellowTo: 40,
          minorTicks: 5,
          max: 60
        };
        var chart = new google.visualization.Gauge(document.getElementById('tempe'));
        chart.draw(data, options);
      }
    </script>
<script type='text/javascript'>
      google.load('visualization', '1', {packages:['gauge']});
      google.setOnLoadCallback(drawChart);
      function drawChart() {
        var data = google.visualization.arrayToDataTable([
          ['Label', 'Value'],
          ['%', <?PHP echo $umido; ?>]
        ]);
        var options = {
          width: 400, height: 120,
          redFrom: 90, redTo: 100,
          yellowFrom:75, yellowTo: 90,
          minorTicks: 5
        };
        var chart = new google.visualization.Gauge(document.getElementById('umido'));
        chart.draw(data, options);
      }
    </script>

</HEAD>
<BODY>
<div align="center">
	<table border="0">
<tr><th align="center" colspan="2"><h1>Grafico Temperatura</h1></th></tr>
<tr><td align="right" width="55%"><h2>Temperatura attuale:</h2></td><td><div id='tempe'></div></td></tr>
<tr><th align="center" colspan="2"><div id="temperatura" style="width: 900px; height: 500px;"></div></th></tr>
<tr><th align="center" colspan="2"><h1>Grafico Umidita'</h1></th></tr>
<tr><td align="right" width="55%"><h2>Umidita' attuale:</h2></td><td><div id='umido'></div></td></tr>
<tr><th align="center" colspan="2"><div id="umidita" style="width: 900px; height: 500px;"></div></th></tr>
<tr><form id= "mioForm" action="index.php" method="get">
	<th align ="center">
Pagina: <select name="pag" onchange='this.form.submit()'>
	<?PHP
	for($a = 1; $a <= $pp ; $a++) {
		echo '<option value="'.$a.'"';
		if ($a == $pag/$val) echo ' selected';
		echo '>'.$a.'</option>';
	}
	?>
</br>
</select>
   Numero Valori: <select name="nrv" onchange='this.form.submit()'>
	<?PHP
	for($a =1; $a <= 50; $a++)  {
		echo '<option value="'.$a.'"';
		if ($a == $val) echo ' selected';
		echo '>'.$a.'</option>';
	}
	?>
</select>
   <noscript><input type="submit" value="Submit"></noscript></th>
</form>
	</table>
</div>
</BODY>
</HTML>
You can draw and build a little box that contains all the components, with a software that has the Laser Cut options (Inkscape in this case):
1. The first thing to do is to configure the wireless network, the graphical interface that manages Arduino is called Luci. Once you connected the Arduino YUN to the network, enter the address on the PC "http://arduino.local" or the IP address. We must enter the password for the network management screen modules, now just click configure to set basic parameters. The default password is "Arduino".
2. Now we need to add some packages Linux on Windows. For your convenience we can use the Putty client. Let's connect to the Arduino setting the ssh on port 22.
3. Now login as root with the password that we set in the initial configuration.
4. We install the web server uhttpd with the PHP interpreter by typing the following commands:
opkg update
opkg install php5 php5-cgi
5. Now we need to modify the configuration file of the server uhttpd to make active the interpreter by typing the following commands:
uci set uhttpd.main.interpreter=".php=/usr/bin/php-cgi"
uci set uhttpd.main.index_page="index.html index.htm default.html default.htm index.php"
uci commit uhttpd
sed -i 's,doc_root.*,doc_root = "",g' /etc/php.ini
sed -i 's,;short_open_tag = Off,short_open_tag = On,g' /etc/php.ini
6. Reboot the server by typing the following command:
/ etc / init.d / restart uhttpd
For memory issues we have added a microSD where will be saved the file containing the temperatures and we have created a link with the public folder "/ www / php":
ln-s / mnt/sda1 / www / php
In my case, the microSD is mounted as sda1.
Now to get access to the SD card from the PC in a network we install server sftpd typing:
opkg install openssh-sftp-server
And through a client (filezilla in this case) we access with root user to the directory.
FlorinAngelo
 Arduino_Scuola


Comments