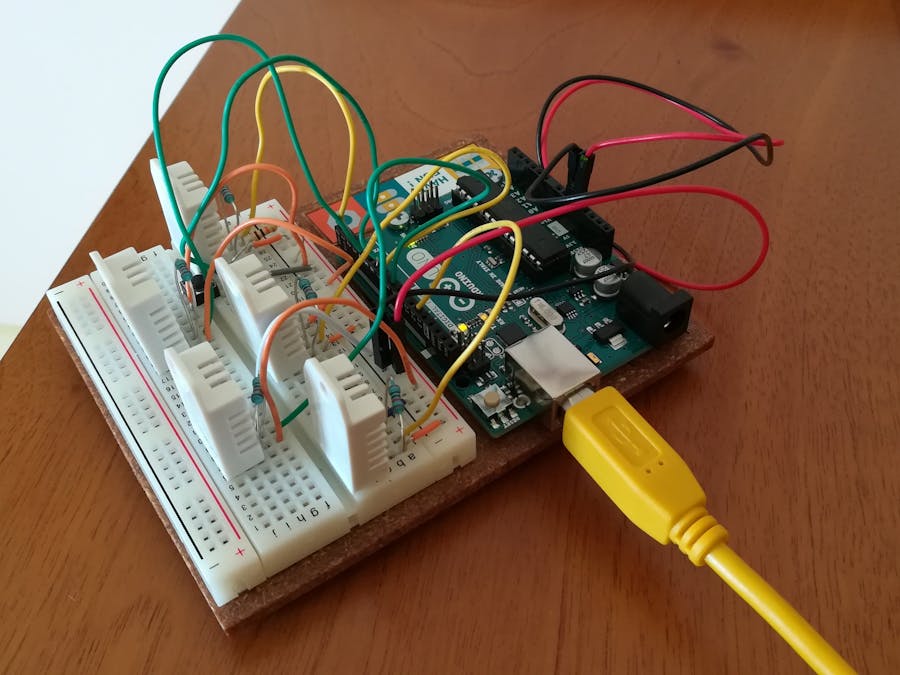
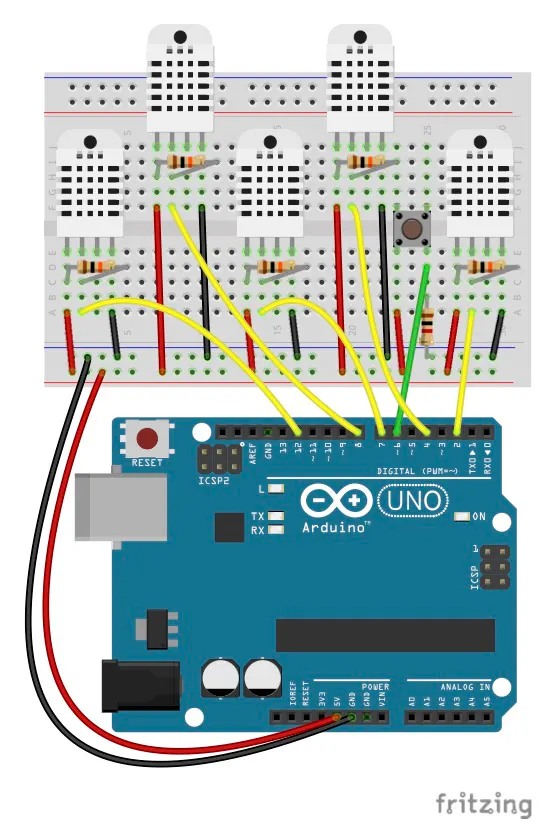
% Script to test a bundle of 5 DHT22 sensors with an Arduino (Uno)
% microcontroller. Acquire data from the sensors until a stop button is
% pressed on the board or a time limit is reached. Plot last 10 minutes of
% live data during acquisition, the entire data set after the acquisition,
% and save these data on a spreadsheet.

close all
instrreset
clear
clc

% Acquisition time (min). Insert inf to disable time limit.
waitTime = 10;

%% Acquire and display live data

% Open serial communication
s = serial('/dev/cu.usbmodem411','BAUD',9600);

figure
color = ['b', 'r', 'g', 'm', 'c', 'b', 'r', 'g', 'm', 'c'];
for i = 1:5
    h(i) = animatedline('Color',color(i),'LineWidth',2);
end
axh = gca;
axh.YGrid = 'on';
axh.YLim = [30 80];
xlabel('Time')
ylabel('Humidity (%)')
legend('Sensor 1', 'Sensor 2', 'Sensor 3', 'Sensor 4', 'Sensor 5',...
    'Location','NorthWest')

figure
for i = 6:10
    h(i) = animatedline('Color',color(i),'LineWidth',2);
end
axt = gca;
axt.YGrid = 'on';
axt.YLim = [10 40];
xlabel('Time')
ylabel('Temperature (\circC)')
legend('Sensor 1', 'Sensor 2', 'Sensor 3', 'Sensor 4', 'Sensor 5',...
    'Location','NorthWest')

stop = false;
waitTime = duration(0,waitTime,0);
startTime = datetime('now');
t = datetime('now') - startTime;

while ~stop && t < waitTime

    % Read data from serial port
    fopen(s);
    idn = fscanf(s);
    fclose(s);

    % Separate data
    C = strsplit(idn,':');

    % Display data in MATLAB command window
    serialData = str2double(C);

    % Humidity correction factor from measurement of sensor 5
    corrData = serialData;
    % First acquisition should be without correction. For the first time leave lines 66 to 68 commented. I have used an external tool to verify temperature and humidity readings and it appeared that sensor number 5 read both correctly in several condition. I have written the humCorr.m function to fix the other sensors readings from the value of sensor 5. If interested in correction, manipulate humCorr.m function and/or the following lines according to your needs.
    %for i = 1:4
    %   corrData(i) = serialData(i) * humCorr(serialData(5),i);
    %end

    disp(corrData)

    % Get current time
    t = datetime('now') - startTime;

    % Add points to animation (humidity data)
    for i = 1:5
        addpoints(h(i),datenum(t),corrData(i))
    end

    % Update axes
    axh.XLim = datenum([t-seconds(600) t]);
    datetick('x','keeplimits')
    drawnow

    % Add points to animation (temperature data)
    for i = 6:10
        addpoints(h(i),datenum(t),corrData(i))
    end

    % Update axes
    axt.XLim = datenum([t-seconds(600) t]);
    datetick('x','keeplimits')
    drawnow

    % Check stop condition from serial monitor
    if str2double(C{end}) == 999
        stop = true;
    end
end

% Output message
if stop
    disp('Data acquisition ended because the STOP button has been pressed')
else
    disp('Data acquisition ended because the TIME limit has been reached')
end

%% Plot the recorded data

for i = 1:5
    [~,humLogs(i,:)] = getpoints(h(i));
    [timeLogs,tempLogs(i,:)] = getpoints(h(i+5));
end
timeSecs = (timeLogs-timeLogs(1))*24*3600;

figure
subplot(1,2,1)
plot(timeSecs,humLogs,'LineWidth',2)
grid on
ax = gca;
ylim([round(ax.YLim(1)-2), round(ax.YLim(2)+2)])
xlabel('Elapsed time (s)')
ylabel('Humidity (%)')

subplot(1,2,2)
timeSecs = (timeLogs-timeLogs(1))*24*3600;
plot(timeSecs,tempLogs,'LineWidth',2)
hold off, grid on
ax = gca;
ylim([round(ax.YLim(1)-2), round(ax.YLim(2)+2)])
xlabel('Elapsed time (s)')
ylabel('Temperature (\circC)')
legend('Sensor 1', 'Sensor 2', 'Sensor 3', 'Sensor 4', 'Sensor 5',...
    'Location','Best')

%% Save results to a file

T = table(timeSecs',humLogs',tempLogs','VariableNames',...
    {'Time_s','Relative_Humidity','Temperature_C'});
filename = 'Humidity_and_Temperature_Data.xls';

% Delete previous file, if exists, to avoid append of data
if exist(filename,'file')
    delete(filename)
end

% Write table to file
writetable(T,filename)
% Print confirmation to command line
fprintf('Results table with %g humidity and temperature measurements saved to file %s\n',...
    length(timeSecs),filename)

%% Summary charts with original data, averaged data, and uncertainty

for sensor = 1:5

    % Smooth out readings with moving average filter
    smoothHum = smooth(humLogs(sensor,:),25);
    smoothTemp = smooth(tempLogs(sensor,:),25);

    % Typical accuracy of the humidity sensor
    humMax = 1.02 * smoothHum;
    humMin = 0.98 * smoothHum;

    % Worst accuracy of the humidity sensor
    humMaxW = 1.05 * smoothHum;
    humMinW = 0.95 * smoothHum;

    % Accuracy of the temperature sensor
    tempMax = smoothTemp + 0.5;
    tempMin = smoothTemp - 0.5;

    figure
    subplot(1,2,1), hold on
    plot(timeSecs,humLogs(sensor,:),'b','LineWidth',2)
    plot(timeSecs,smoothHum,'r','LineWidth',1)
    plot(timeSecs,humMin,'r--','LineWidth',2)
    plot(timeSecs,humMax,'r--','LineWidth',2)
    plot(timeSecs,humMinW,'m--','LineWidth',1)
    plot(timeSecs,humMaxW,'m--','LineWidth',1)
    hold off, grid on, ylim([round(min(humMinW))-2, round(max(humMaxW))+2])
    xlabel('Elapsed time (s)')
    ylabel('Humidity (%)')
    title(['Humidity data, average, and uncertainty for sensor ',num2str(sensor)])

    subplot(1,2,2), hold on
    plot(timeSecs,tempLogs(sensor,:),'b','LineWidth',2)
    plot(timeSecs,smoothTemp,'r','LineWidth',1)
    plot(timeSecs,tempMin,'r--','LineWidth',2)
    plot(timeSecs,tempMax,'r--','LineWidth',2)
    hold off, grid on, ylim([round(min(tempMin))-2, round(max(tempMax))+2])
    xlabel('Elapsed time (s)')
    ylabel('Temperature (\circC)')
    title(['Temperature data, average, and uncertainty for sensor ',num2str(sensor)])

end


_ztBMuBhMHo.jpg?auto=compress%2Cformat&w=48&h=48&fit=fill&bg=ffffff)


_3u05Tpwasz.png?auto=compress%2Cformat&w=40&h=40&fit=fillmax&bg=fff&dpr=2)
Comments