
Hardware components | ||||||
| × | 1 | ||||
 |
| × | 1 | |||
 |
| × | 1 | |||
 |
| × | 1 | |||
Software apps and online services | ||||||
 |
| |||||
 |
| |||||
| ||||||
This project measures and displays your heart rate in beats per minute alongside a graphical representation and an SMS alert system.The circuit has an accuracy of 4 beats per minute and it is very easy to use. It is a pretty simple project which requires only 4 components.
It essentially consists of four processes :
1.Sensing
The used sensor works on the principle of Plethysmography : When the heart expands (diastole) the volume of blood inside the finger tip increases and when the heart contrcats (systole) the volume of blood inside the finger tip decreases. The resultant pulsing of blood volume inside the finger tip is directly proportional to the heart rate and if you could some how count the number of pulses in one minute, that’s the heart rate in beats per minute (bpm). For this an IR transmitter/receiver pair placed in close contact with the finger tip. When the heart beats, the volume of blood cells under the sensor increases and this reflects more IR waves to sensor and when there is no beat the intensity of the reflected beam decreases. The pulsating reflection is converted to a suitable current or voltage pulse by the sensor.
This voltage is then converted to digital pulses by the on-chip A-D conversion circuit. The Bolt wifi Module reads this data through its GPIO pin and sends it the Bolt cloud.
2.Processing
The data transmitted to the cloud is accessed using the Heartrate.py program with the help of the modules API Key and Device ID. I have used the Ubuntu app on Windows to execute this program. It reads the HIGH/LOW pulses using the digital.read function and keeps a count of it. It is then multiplied with the suitable conversion factor to get the heart rate in beats/min and is displayed on the terminal as the process is executed.
3.Visualization
The value obtained is then displayed in the form of a gauge chart comparing it with the standard range. I have installed and used Plotly - an open source graphic library for python, for this purpose. It is displayed in the form of a pop-up screen as and when the heart rate is measured.
4.SMSAlerts
The value obtained is compared with the standard range and a corresponding SMS alert is sent to your number specifying your heart rate and if it falls in the normal range. I have used Twilio's Programmable SMS service for this purpose.
II. Bolt WIFI ModuleIt is an ESP8266 base wifi module with custom firmware and user friendly cloud interface. The process of setting up your module is explained in detail here : https://docs.boltiot.com/docs/setting-up-the-bolt-wifi-module
Note : The standard plan that comes with the module gives a rate of 20 API hits/min after which is rate limited to make sure every user gets a fair share of usage and to keep their systems working in optimum way possible. However this application required higher bandwidth and speed so I upgraded to their Pro version with a fee of Rs. 50 INR for a one-month subscription. This fee helps them pay the additional amount towards the cost of the AWS servers which is required to offer the additional bandwidth. The link for this subscription is : https://cloud.boltiot.com/login?next=%2Fview_profile%2Fplan
III. Creation of Twilio accountTwilio is a third-party SMS functionality provider. It is a cloud communications platform as a service (PaaS) company. Twilio allows software developers to programmatically make and receive phone calls and also send and receive text messages using its web service APIs.
Please note that SMS delivery via a trial Twilio account is not guaranteed to be instant by Twilio. Also, note that SMS will not be sent to numbers which have DND(Do Not Disturb) turned ON.
Step 1: Open https://www.twilio.com/ In browser.
Step 2: Click on Get a Free API Key button to sign up.
Step 3: Fill all the necessary details in SIGN UP form.
Step 4: To verify they will ask for your phone number. Choose India as an option in the dropdown and then enter your phone number.
Step 5: Click on "Products".
Step 6: Now enable the SMS services by clicking on two checkboxes for Programmable SMS and Phone Numbers.
Once you have done this, scroll to the bottom of the screen and click on "Continue".
Step 7: Now, you will need to give a name for your project. Click on "Continue" once you have entered the project name.
Step 8: Click on "Skip this step" when it asks you to Invite a Teammate.
Step 9: Your project should be created at this point. Click on "Project Info" to view the account credentials which is required for your projects.
Step 10: You can view the Account SID and Auth token on this page. The Auth token is not visible by default, you can click on "view" button to make the Auth token visible as shown below. Copy both and save them somewhere securely.
Step 11: From the drop-down menu, choose "Programmable SMS". Now click on Get Started button to generate phone number.
Step 12: Click on Get a number button.
Step 13: Then a popup will appear. Click on Choose this number button.
Step 14: Then a popup will appear which will have the final number. Copy this number and save to notepad for future references.
That's it. You have successfully created the account on Twilio.
IV. Installing Plotly libraryThe plotly Python library (plotly.py) is an interactive, open-source plotting library that supports over 40 unique chart types covering a wide range of statistical, financial, geographic, scientific, and 3-dimensional use-cases. You need to install the library before execution of the program.
plotly.py may be installed using pip...
$ pip install plotly==4.6.0or conda.
$ conda install -c plotly plotly=4.6.0Note: No internet connection, account, or payment is required to use plotly.py
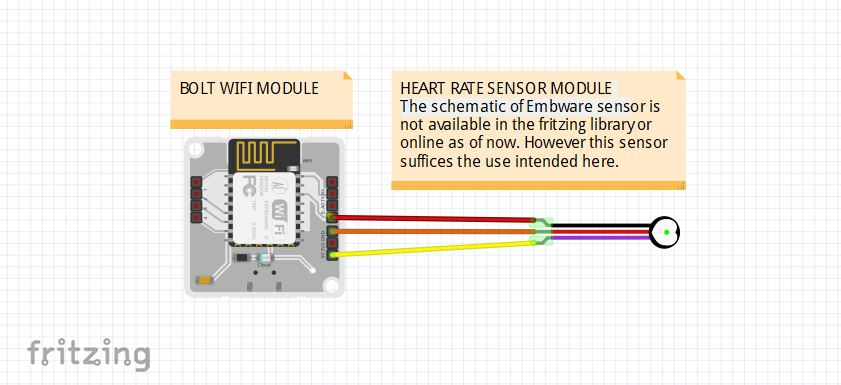
V. Circuit ConnectionThe circuit connection is the easiest part of this project. I have used a 3 wire Male to Female jumper to connect :
1. 'O/P' pin of sensor to '0/GPIO' pin of wifi module (Red wire in picture)
2. '5V' pin of sensor to '5V' pin of wifi module (Yellow wire in picture)
3. 'G' pin of sensor to 'GND' pin of wifi module (Orange wire in picture)
To provide power to the Bolt wifi module, I have used a standard Micro-USB cable. It can be connected to the USB port of your Laptop/Computer or to the power socket using a suitable adapter.
VI. Configuration fileThe python coding for this project has been done in Ubuntu. It is necessary to make a configuration file which will have the specific keys for each user/device and it will be imported in our main code with various attributes. Each new user will only have to change the contents the configuration file to use the product.
The API key and Device ID of the Bolt module can be obtained from your Bolt Cloud webpage. The other credentials like SID and AUTH_TOKEN can be obtained from your Twilio account dashboard.
1. This part imports the libraries of all the functions used in the following section.
2. This part fetches credentials and assigns it to their respective functions
3. This part declares and assigns initial values to the variable used ahead in the code.
4. This block of code is the part where the main data is processed and the HeartRate is calculated and displayed
5. This block compares the heart rate value with the normal range and sends the respective alert using Twilio.
6. The final block of code is the specifications of the Guage chart variables and displays the chart with the reading in a browser window. In the end the program is put to sleep for 20 seconds before the next reading.
VIII. Step-Wise execution1. Set up Bolt cloud account and sync your module
2. Set up Twilio account
3. Install plotly library
4. Connect the Circuit
5. Create the configuration file using the command :
$ sudo nano conf.py6. Type the code provided in conf.py (configuration code) using your credentials. Save and exit.
7. Create the Main file using the command :
$ sudo nano heartrate.py8. Type the code provided in heartrate.py (main code). Save and exit.
9. Place your finger on the are specified in the sensor and execute the program using the following command :
$ sudo python3 heartrate.py10. Tadaa! The output will be displayed in the terminal.
IX. Output Snippets


Comments