


Hardware components | ||||||
 |
| × | 1 | |||
 |
| × | 1 | |||
| × | 1 | ||||
 |
| × | 1 | |||
| × | 1 | ||||
Software apps and online services | ||||||
| ||||||
| ||||||
 |
| |||||
I participated in this challenge as I worked with artificial intelligence and neural networks twenty years ago, using my old Intel 386 PC with Matlab to design and train neural networks for non-destructive analysis projects on materials. Today I would like to deepen FPGA technology to create onboard Artificial Intelligence projects capable of real-time processing.
Preparation of the work environmentI followed the AVNET manual precisely at https://www.element14.com/community/servlet/JiveServlet/previewBody/93372-102-4-384234/Ultra96-V2-GSG-v1_1.pdf
After a quick look at the board to identify its main components, I moved on to preparing the SD card for the operating system.
Writing to the SD cardThe image and installation guide have been downloaded from the link http://avnet.me/ultra96-v2-oob
The guide is a short pdf that explains the steps to take to load the image into the SD card. First, you need to open the link: https://www.balena.io/etcher/ to download etcher, a simple and reliable tool for uploading image files to SD cards.
I chose the portable Windows version.
Once the card has been written and inserted into its slot, we can turn on the device.
First, we connect the power supply to 220V, then insert the 12V connector into the special Ultra96 plug. A green led next to the power connector will light up. Then we connect a micro USB cable to the USB to JTAG / UART pod adapter board and the orange led next to the micro USB connector will light up.
Now we have to open a terminal to connect to the device by emulating a serial link. I use Putty for this purpose but, to configure it, I need to know which COM port the card is connected to. To do this, just open "Device Manager" on Windows and view which COM port is active.
Now we need to configure Putty parameters:
Communication between Putty and Ultra96 card is perfect.
In the video, we can see the board boot phases that stop with the user and password request.
We use the default credentials:
- username: root
- password: root
You enter the operating system and can work on the operating system files and settings. The current directory is the root directory of the operating system and the 4 files are present:
- ble.sh
- bt.sh
- wifi.sh
- wpa_supplicant.conf
They are necessary for configuring the WiFi and Bluetooth connections.
Since its start, the Ultra96 card activates an access point with the name Ultra96 followed by the MAC address of the card. By connecting the PC to this AP we can view the WebApp by typing 192.168.2.1 from a browser.
You can obviously get to know the board using the proposed examples and then you can create your own projects.
To configure an Internet connection in order to install necessary updates or packages, or to insert the card in your local network, you must configure access by entering the SSID and password of the network. These configurations, once the card is turned off, are lost.
To make them stable, you need to modify the wpa_supplicant.conf file, by entering the SSID of the local network and its password.
wpa_supplicant.conf
ctrl_interface=/var/run/wpa_supplicant
ctrl_interface_group=0
update_config=1

network={
  ssid="your wifi ssid"
  psk="your wifi password"
}
Once the file has been modified, the board connects to the local WiFi network and can therefore be easily configured via SSH from any PC on the local network.
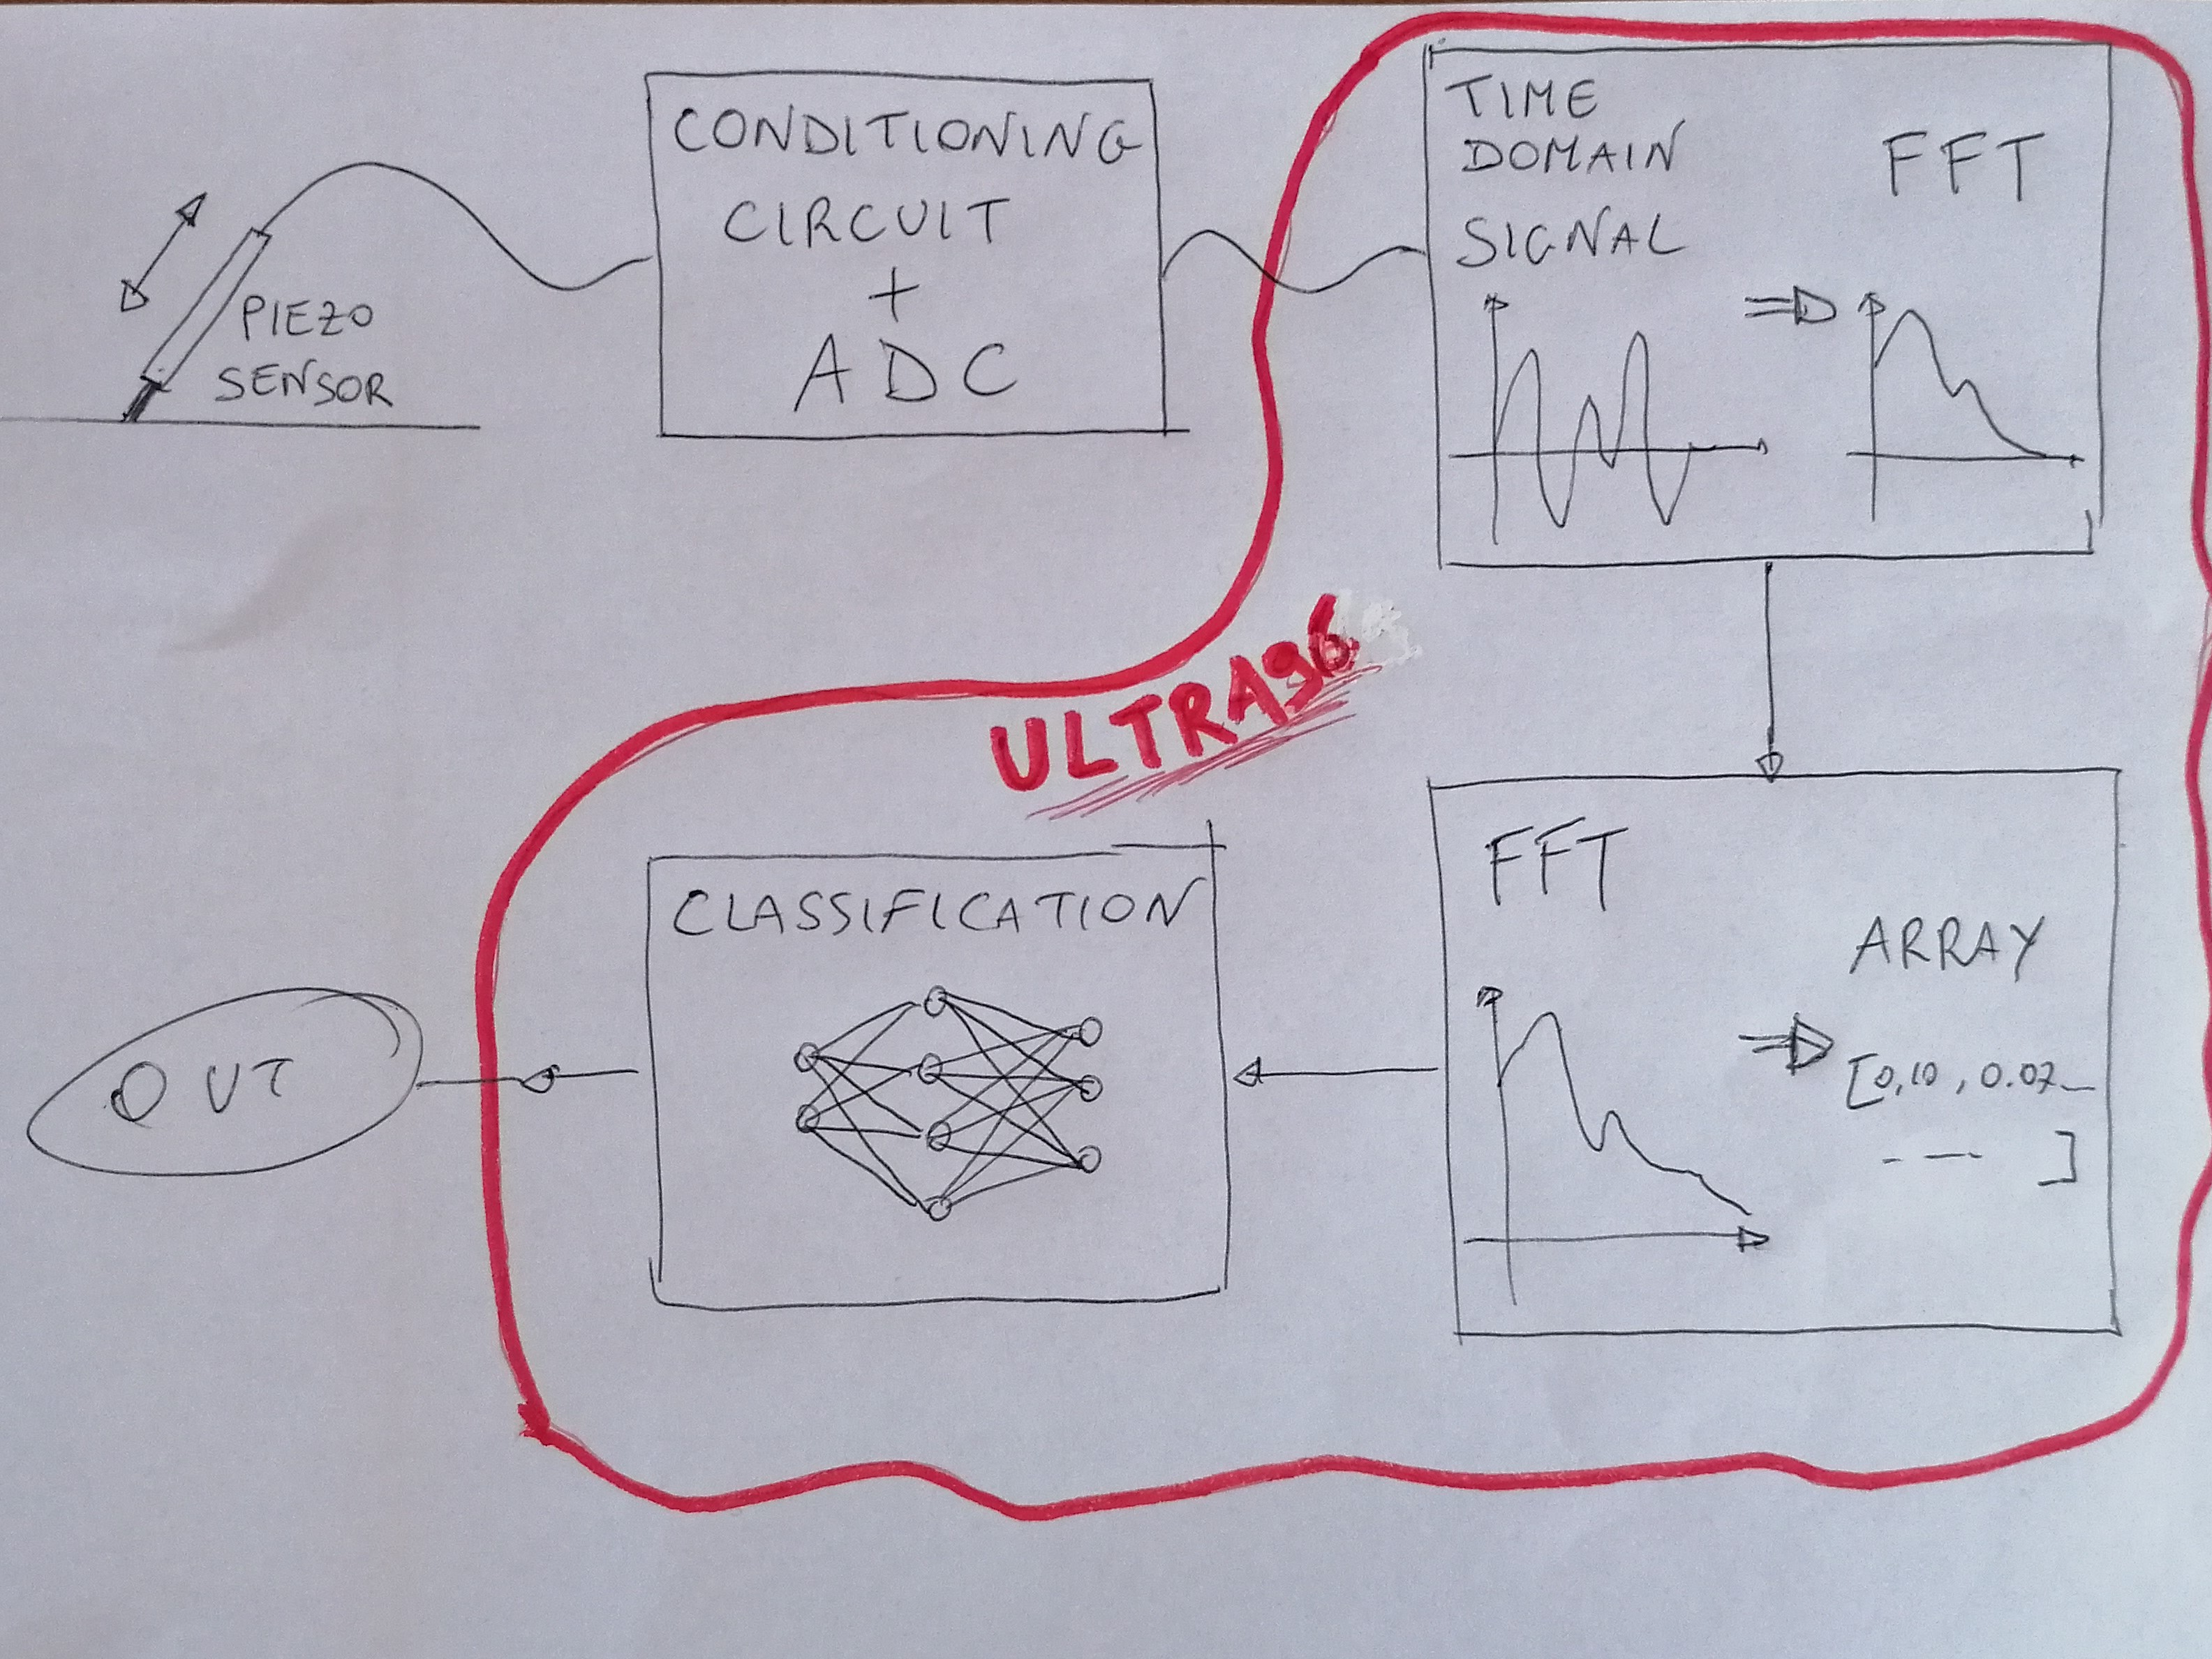
My projectWhat I want to create is a system capable of receiving an audio signal and calculating its spectral components. The aim is to obtain an array of spectral components which, given as input to a neural network, can allow the classification of the signal and its recognition.
Since the Ultra96-v2 is a board with considerable capabilities and requires a very in-depth study, I chose to focus on the design aspect, focusing only on a few aspects.
To start, I will leave out the part relating to the acoustic sensor and signal conditioning and I will start by considering an audio signal in a.wav file.
A Python application will calculate the spectrum and the 10 spectral components that I will need for the classification and display the related graphs.
The application, spettro.py, was written, built, and tested using Visual Studio on my PC and then uploaded to the Ultra96 projects section through the web interface.
The source files used for this test, monophonic and in wav format, were uploaded using the WEB upload interface. They are located in the directory: /usr/share/ultra96-startup-pages/webapp/templates/CustomContent/uploaded_files and can be used by Python applications.
There are other important directories, for example:
/usr/share/ultra96-startup-pages/webapp/templates/CustomContent/uploaded_files/ for file upload
/usr/share/ultra96-startup-pages/webapp/static/images for the images
/usr/share/ultra96-startup-pages/webapp/templates/CustomContent/custom for py files
Problems with PythonSeeing the simple Hello World example made in Python I noticed that the webserver was configured to use an older version of Python.
Actually, the board already has Python version 3.5 but it is not the system default one. In order to use it I used the command:
update-alternatives --install /usr/bin/python python /usr/bin/python3.5 1
Once this command has been executed, the default version has become 3.5 and I was, therefore, able to proceed with the use of this version.
Since we want to work with frequency spectra of audio signals, we need to install three Python libraries: Cython, Numpy, and Matplotlib. To install these three libraries we will use the following command.
- pip3 install xxxxxxxxx
We point out that this operation can take a long time so it is important to be patient and trust that everything is going well.
The webserver (and its problems)The main file that manages the webserver is located in /usr/share/ultra96-startup-pages/webapp/ and is webserver.py.
The web server code is very simple and functional but it presents a problem that made me waste a lot of time.
When we create a webapp, as I wanted to do, we have to implement the three aspects of a webapp and we have to create the application that produces the data, a frontend page for users interactions and a backend page that interfaces with the board.
When we finish creating the three components of the webapp, we test their operation and finally load them on the board using the appropriate command in the Ultra96 web interface. No error messages produced, everything seems to be ok.
We therefore expect that, restarting the system, typing the web page of the Ultra96, our web application should appear, but it is not.
The Ultra96 web page disappears and cannot be accessed.
After researching on the Internet I saw that this is a problem that many other users have encountered and I have been able to implement the solution. The problem is very clearly described in a post by Whitney Knitter that helped me a lot (https://www.hackster.io/whitney-knitter/ultra96-sdr-part-one-simple-rf-spectrogram-web-application-aae29e).
Commenting on two lines of the webserver.py file, the problem is solved and I can finally see my webapp.
The project so farAt the moment I'm about halfway through my work. I have already purchased the acoustic sensor (a cylindrical piezoceramic sensor) and designed the conditioning circuit using analog electronics to adapt the signal obtained to an ADC converter.
The webapp works quite well, although it can obviously be improved. I load a.wav file and it will be processed thanks to the python program and the spectral components will be extracted. As I set up the program, I can choose how many spectral components to evaluate at startup. At the moment, for simplicity, I use 10 spectral components.
The webapp is therefore an application that, received in input a wav file, produces a normalized vector from 0 to 1 of 10 spectral components.
The next phase of my project will be to make my webapp obtain the data to be analyzed not from a.wav file, as I did in this first version of the project, but directly from the ADC.
Once the input management is complete and reliable, I will have to carry out the third phase of my project.
The third and last phase is the one in which I use the Ultra96-v2 exploiting it to create a simple Artificial Intelligence engine. The neural network, having received the spectral components as inputs, will classify the input signal. I think this last phase will be the heaviest one as I found very little material on the Internet on the use of the FPCA in the Ultra96 board. It would be really fantastic if Xilinx gave us some working and tested projects to help us in the understanding and optimal use of the Ultra96 board.
This application, which I created more than 20 years ago using very expensive sensors, instrumentation amplifiers, Labview and Matlab acquisition cards for classification and presentation of results, today I would like to create it only with the Ultra96 board and very few other components.
20 years ago....Same problem, different technologies
Unfortunately, we are at the end of the time allowed for this project so I thank all those who have read this article and I invite them to read the conclusion of this project in a couple of months, I hope.
Thanks for the attention
Carlo


Comments