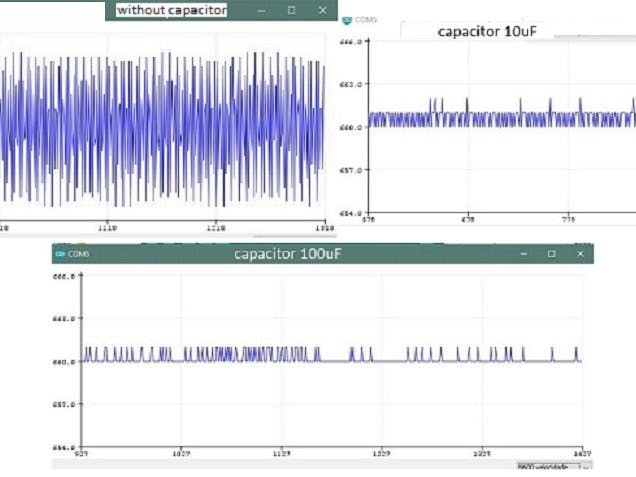
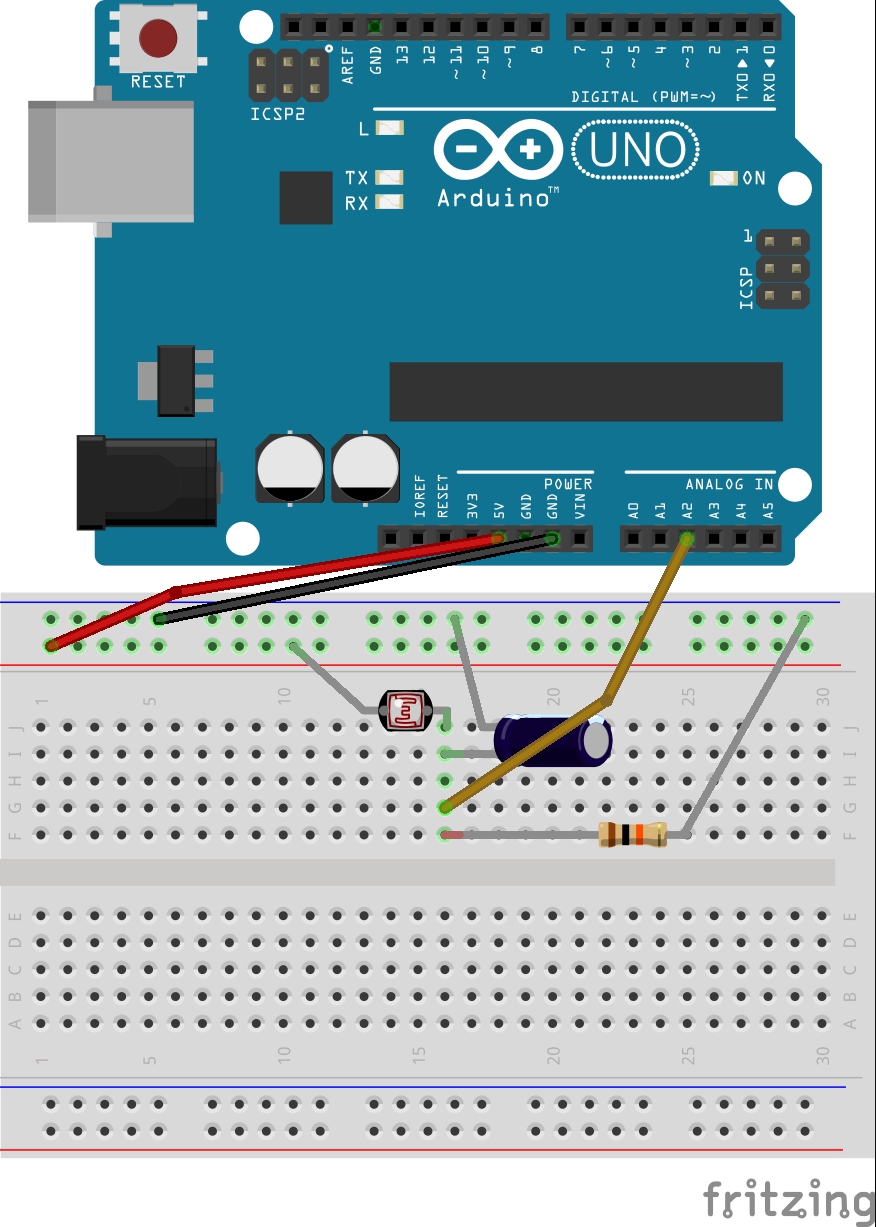
I was looking for a way to watch effect of capacitors to stabilize circuits , but I have found just visual examples like charge and discharge them using leds and so one. Then I decided to develop this example. It uses a circuit with an LDR directed to the ceiling, a resistor, and the capacitors to test, with a Uno and running his Serial Plotter. Changing the capacitors, we can see, as at the main figure, the differences between the ranges:
- without capacitor we get a range from 642 to 675
- with a 10uF capacity, from 660 to 662
- with a 100uF, from 660 to 661
One nice point is that we can change the capacitors with the circuit running, then we can watch the ranges variation directly at the serial plotter.
Finally, please, sorry about my poor English.


_ztBMuBhMHo.jpg?auto=compress%2Cformat&w=48&h=48&fit=fill&bg=ffffff)


Comments