

Hardware components | ||||||
 |
| × | 1 | |||
 |
| × | 1 | |||
 |
| × | 1 | |||
 |
| × | 1 | |||
 |
| × | 1 | |||
Software apps and online services | ||||||
 |
| |||||
In this fast pacing and perfection seeking world it is important to be accurate and accountable for our actions. There is an increasing demand for performing tasks more accurately than ever. Sometimes the accuracy demanded by the task is so high that it is almost impossible for the human capabilites to meet. In such cases advancement in computer technologies come to the rescue.
Consider a scenario in which the owner of the nursery has given you the responsibility of looking after his plants till he returns from his trip. Your job is to water the plants as per their requirement which is based on the light intensity of sun.Now, manually calculating and analysing the light intensity is a tedious and boring job, isn't it? What if you have a device which will calculate and even predict future light intensity after specific intervals of time so that you can just chill out there while the device takes care of your tedious job without compromising on the accuracy?
In this, we are going to build the same project using Bolt IoT Wifi Module and by applying different algorithms.
2. Explanation of Polynomial RegressionPrediction : To be able to think and realize what will happen in the future is called prediction.
Polynomial Regression : It is a machine learning algorithm. A polynomial equation is of the form y=f(x) where f(x) is sum of different powers of x.
Prediction points: This number tells the Visualizer how many future data points need to be predicted. By default, the Visualizer spaces the points with the data collection time in the hardware configuration of the product. So if you set the product to collect data every 5 minutes, and select 6 prediction points, the Visualizer will predict the trend and show 6 points up to 30 minutes into the future.
No. Polynomial coefficients: Polynomial Visualizer processes the given input time-dependent data, and outputs the coefficients of the function of the form:
which most closely resembles the trend in the input data. This number tells the Visualizer how many elements should be present in the function i.e. the value of n.
Frame Size: These are the number of previous data points the Visualizer will use to predict the trend of the data. For example, if you set this value to 5, the Visualizer will use the previous 5 points to predict the trend.
3. Hardware Configuration- Step 1: Insert one lead of the LDR into the Bolt Module's 3v3 Pin.
- Step 2: Insert other lead of the LDR into the A0 pin
- Step 3: Insert one leg of the 10k Ohm resistor into the GND pin
- Step 4: Insert the other leg of the resistor also into the A0 pin
- Warning!! Make sure that at no point do the 3.3V (or even 5V) and GND pins or wires coming out of them touch each other. If you short power to Ground without a resistor even accidentally, the current drawn might be high enough to destroy the Bolt module
Thus, we are effectively measuring the voltage across the 10k Ohm Resistor and the final circuit should look like the image below:
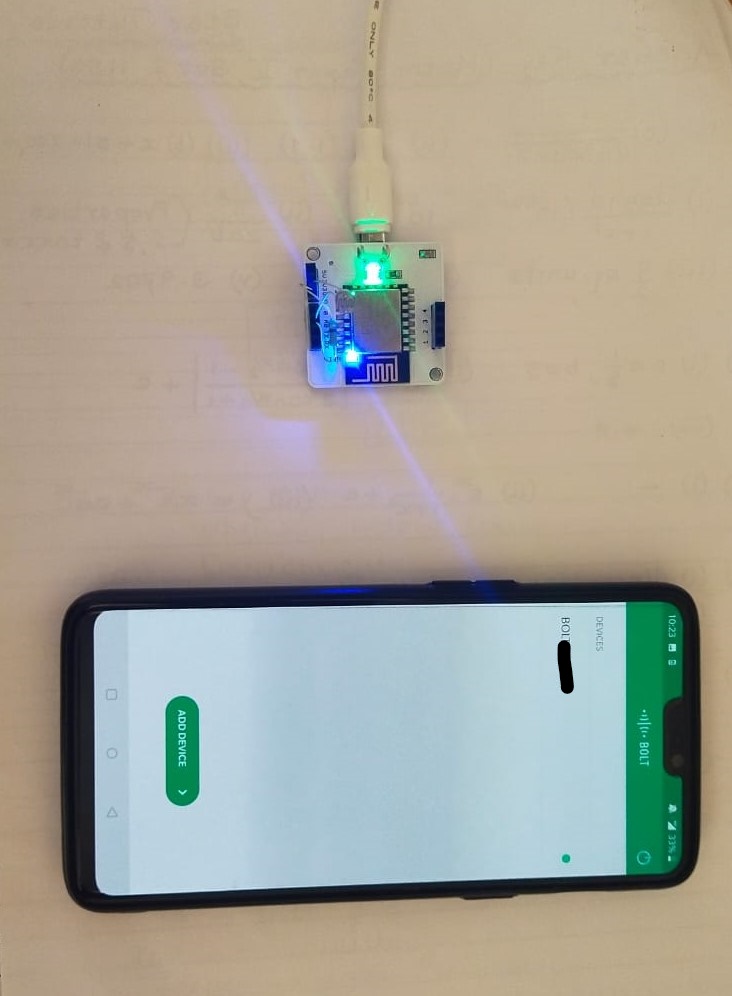
Step 1 : Install and log in to Bolt IoT App.
Step 2 : Link your Bolt Device to the Bolt Cloud using the Bolt App. The device status will be online( green dot).
Step 3: On Bolt Cloud -> Product-> New product-> Select GPIO, Input and name the product and save.
Step 4 : Select the product configuration. a) Hardware : Select A0 pin and name it (in my case, I have named it as light). b) Code : Name the file (light_monitor) and select file extension as 'js'. Copy paste the code (attached at the end of this project) and save.
Step 5 : Link the Bolt Module to the newly created product.
Step 6 : Select deploy configuration -> View this device.
Step 7 : Select 'Predict' to predict the light intensity after a certain period of time.
Here's a graph of our predicted light intensity.


Comments