


Hardware components | ||||||
 |
| × | 1 | |||
Software apps and online services | ||||||
| ||||||
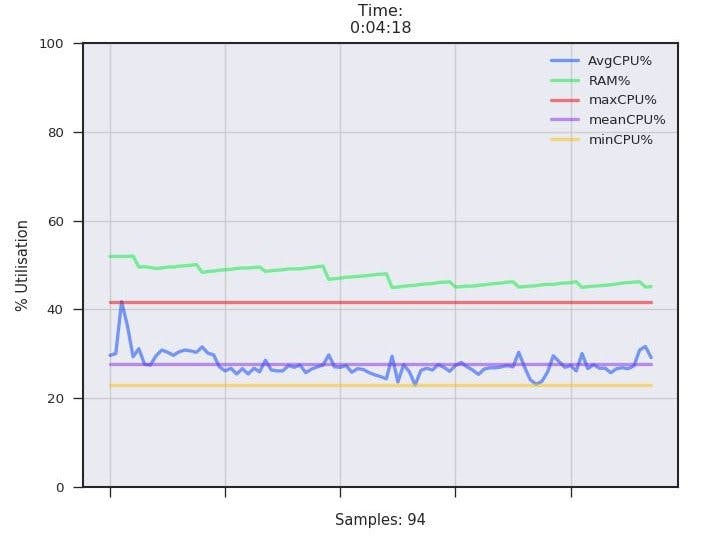
I've spent quite a bit of time playing with various different boards and always wanted a simple solution for displaying the data my sensors were reading. This is the project so far. Its configured to plot CPU and RAM %'s right now but it can easily be changed to plot, say for example, humidity or temperature from a sensor Vs time.
The script uses flask to serve a web app on <Your Ip Address>:8000 to allow for remote access if necessary.
The GET request from the browser starts the App. Every subsequent GET plots new data. If the user leaves the page for longer than 10 secs the app resets.
The index.html file controls the auto refresh and must be placed in a folder called templates, beside the app.
Realistically, because its Python3, you're going to be running this on a RPi. Any sensor you can connect to GPIO can be graphed. (or any device which can communicate with the Pi). If you need help getting it to work for your project message me, maybe I can point you in the right direction
Install- Open a cmd prompt / shell on a machine with Python3 installed.
pip install psutil matplotlib pandas seaborn flask flask_socketio gevent
Save a copy of the app to your machine.
- In the same directory create a new folder called "templates" and put index.html file inside.
cd <dir containing app>
python PyMon.py


Comments